/ THE SHORT ANSWER
- 01A synapse count and a neuron-to-neuron connection count are different quantities.
- 02Network diagrams depend on choices about thresholds and aggregation.
- 03A structural connection does not by itself establish a functional effect.
/ dotSuper point of view
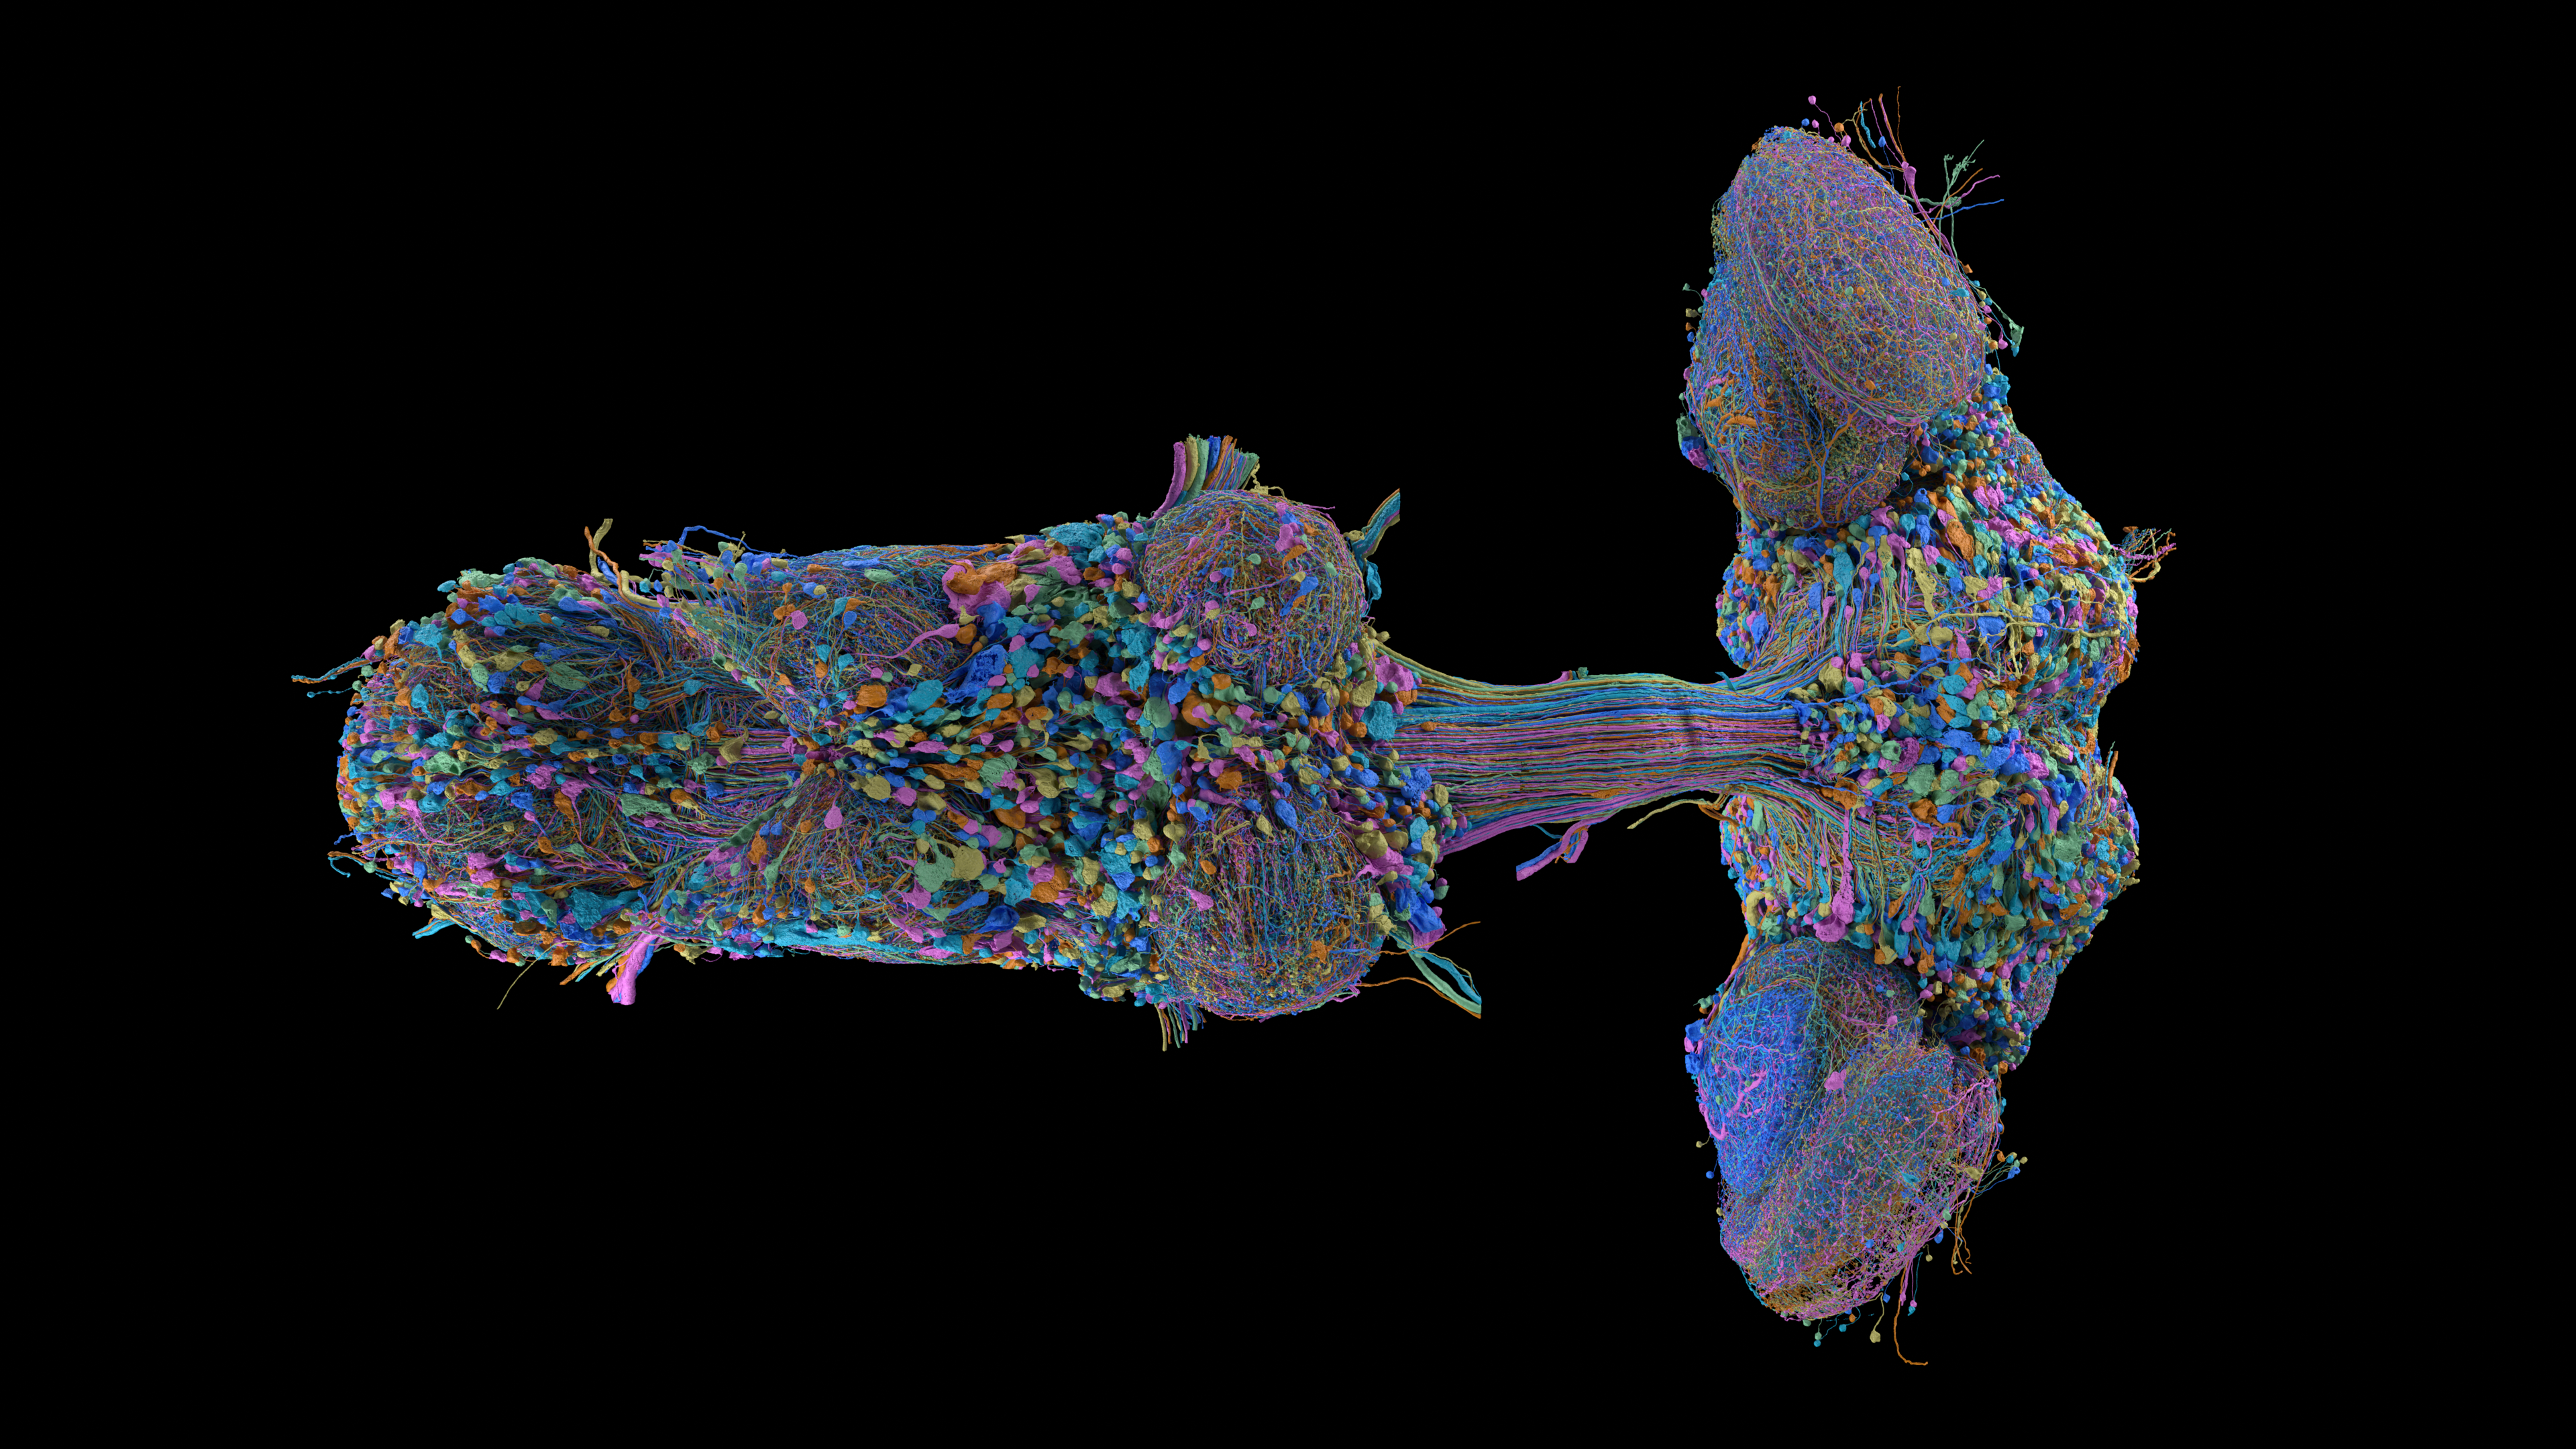
Understanding the difference between structure and function is the most useful skill for reading brain-mapping headlines.
Start with three different objects
A synapse is a site through which one cell can influence another.
A graph connection is an analytical representation chosen by the researcher.
Several synapses can exist between the same pair of neurons.
Combining them into one weighted graph edge changes the unit being counted.
Two reports can describe the same dataset using very different totals without either count being fraudulent.
The practical reading rule is simple: whenever a headline says 'connections', look for the definition.
Is it counting synaptic sites, connected cell pairs or links between entire cell types?
| Term | Meaning | Common mistake |
|---|---|---|
| Neuron | An individual nerve cell | Treating every graph node as an individual cell |
| Synapse count | Count of reconstructed contacts under specified rules | Calling it the number of unique cell pairs |
| Weighted edge | A model's summary of a relationship | Assuming the weight measures live physiological strength |
A network diagram is already an interpretation
The paper specifies a dataset snapshot and reports analyses using defined connection thresholds.
Those details are not housekeeping.
Removing weakly represented edges, combining cells into types or excluding incomplete regions can change network statistics.
A visually simple graph may rest on extensive preprocessing.
Before comparing two diagrams, write down their node definitions and edge rules.
If those differ, compare the methods first rather than immediately interpreting different-looking clusters.
A route is not a measured influence
It does not tell you how much traffic is moving along each route at every moment.
The analogy should not be pushed too far.
Biological cells are active, adaptive systems, not passive road junctions.
The important lesson is that a static relationship and a time-varying effect answer different questions.
If a model claims that a particular connection causes an output, ask which assumptions convert anatomy into dynamics.
Those assumptions are part of the model, not automatically part of the original map.
Why researchers also need interventions
It proposes using the connectome together with controlled perturbations and statistical estimation to investigate how neurons affect one another.
Its methodological argument is important: observations that move together can share an unobserved cause.
Seeing two signals change is not always enough to establish a direct effect.
For readers, the next question is whether a claim comes from anatomy, a computational prediction, an activity recording or an intervention.
Each contributes evidence, but they should not be collapsed into one category.
A five-question checklist for the next headline
Its purpose is to expose missing definitions before a broad claim is accepted.
Apply it to one figure or abstract rather than an entire field.
A precise unanswered question is more useful than declaring that the whole project either explains intelligence or explains nothing.
The strongest summaries describe both the new constraint on scientific explanations and the work still required.
Limitations are part of the discovery's meaning.
- What is a node in this analysis?
- What does an edge count or weight represent?
- Which tissue, specimen and version are included?
- Which measurements or assumptions supply dynamics?
- What experiment would challenge the proposed explanation?
What this page cannot conclude
- 01The transport-map analogy is explanatory, not a mechanistic theory of neurons.
- 02This guide does not imply that connectomes are useless without complete physiological information; they can sharply constrain useful models.
- 03Prepared with AI assistance from the named research sources. dotSuper did not conduct these experiments, independently reproduce the studies or obtain an endorsement from the research institutions.
Sources
- 01Network statistics of the whole-brain connectome of DrosophilaLin et al., Nature (2024) · accessed Sep 15, 2026
- 02The fly connectome reveals a path to the effectomePospisil et al., Nature (2024) · accessed Sep 15, 2026
- 03MaleCNS downloads and programmatic accessMaleCNS project · accessed Sep 15, 2026
- 04Neuronal wiring diagram of an adult brainDorkenwald et al., Nature (2024) · accessed Sep 15, 2026
- 05MaleCNS research media galleryFlyEM / HHMI Janelia and collaborators · accessed Sep 15, 2026
Our editorial standard · Found an error? Send a correction with its source.
/ CITE OR SHARE THIS GUIDE
Make the evidence easy to verify.
When you reference this guide, link to its canonical URL. That gives readers one stable place for the evidence, limitations and future updates.
dotSuper Research Desk. (September 15, 2026). What Is a Connectome, and What Is Missing?. dotSuper. https://dotsuper.net/feeds/applied-systems/what-is-a-connectome-brain-map
How AI Helped Map the Fruit Fly Brain
Continue with a different question in our source-linked fly-brain series.
Read the next explainer