/ THE SHORT ANSWER
See the method. Keep the context.
The visual companion
Reuse: Original artwork created for dotSuper. No public reuse licence has been specified. Attribution to research sources does not grant rights to their artwork or datasets.
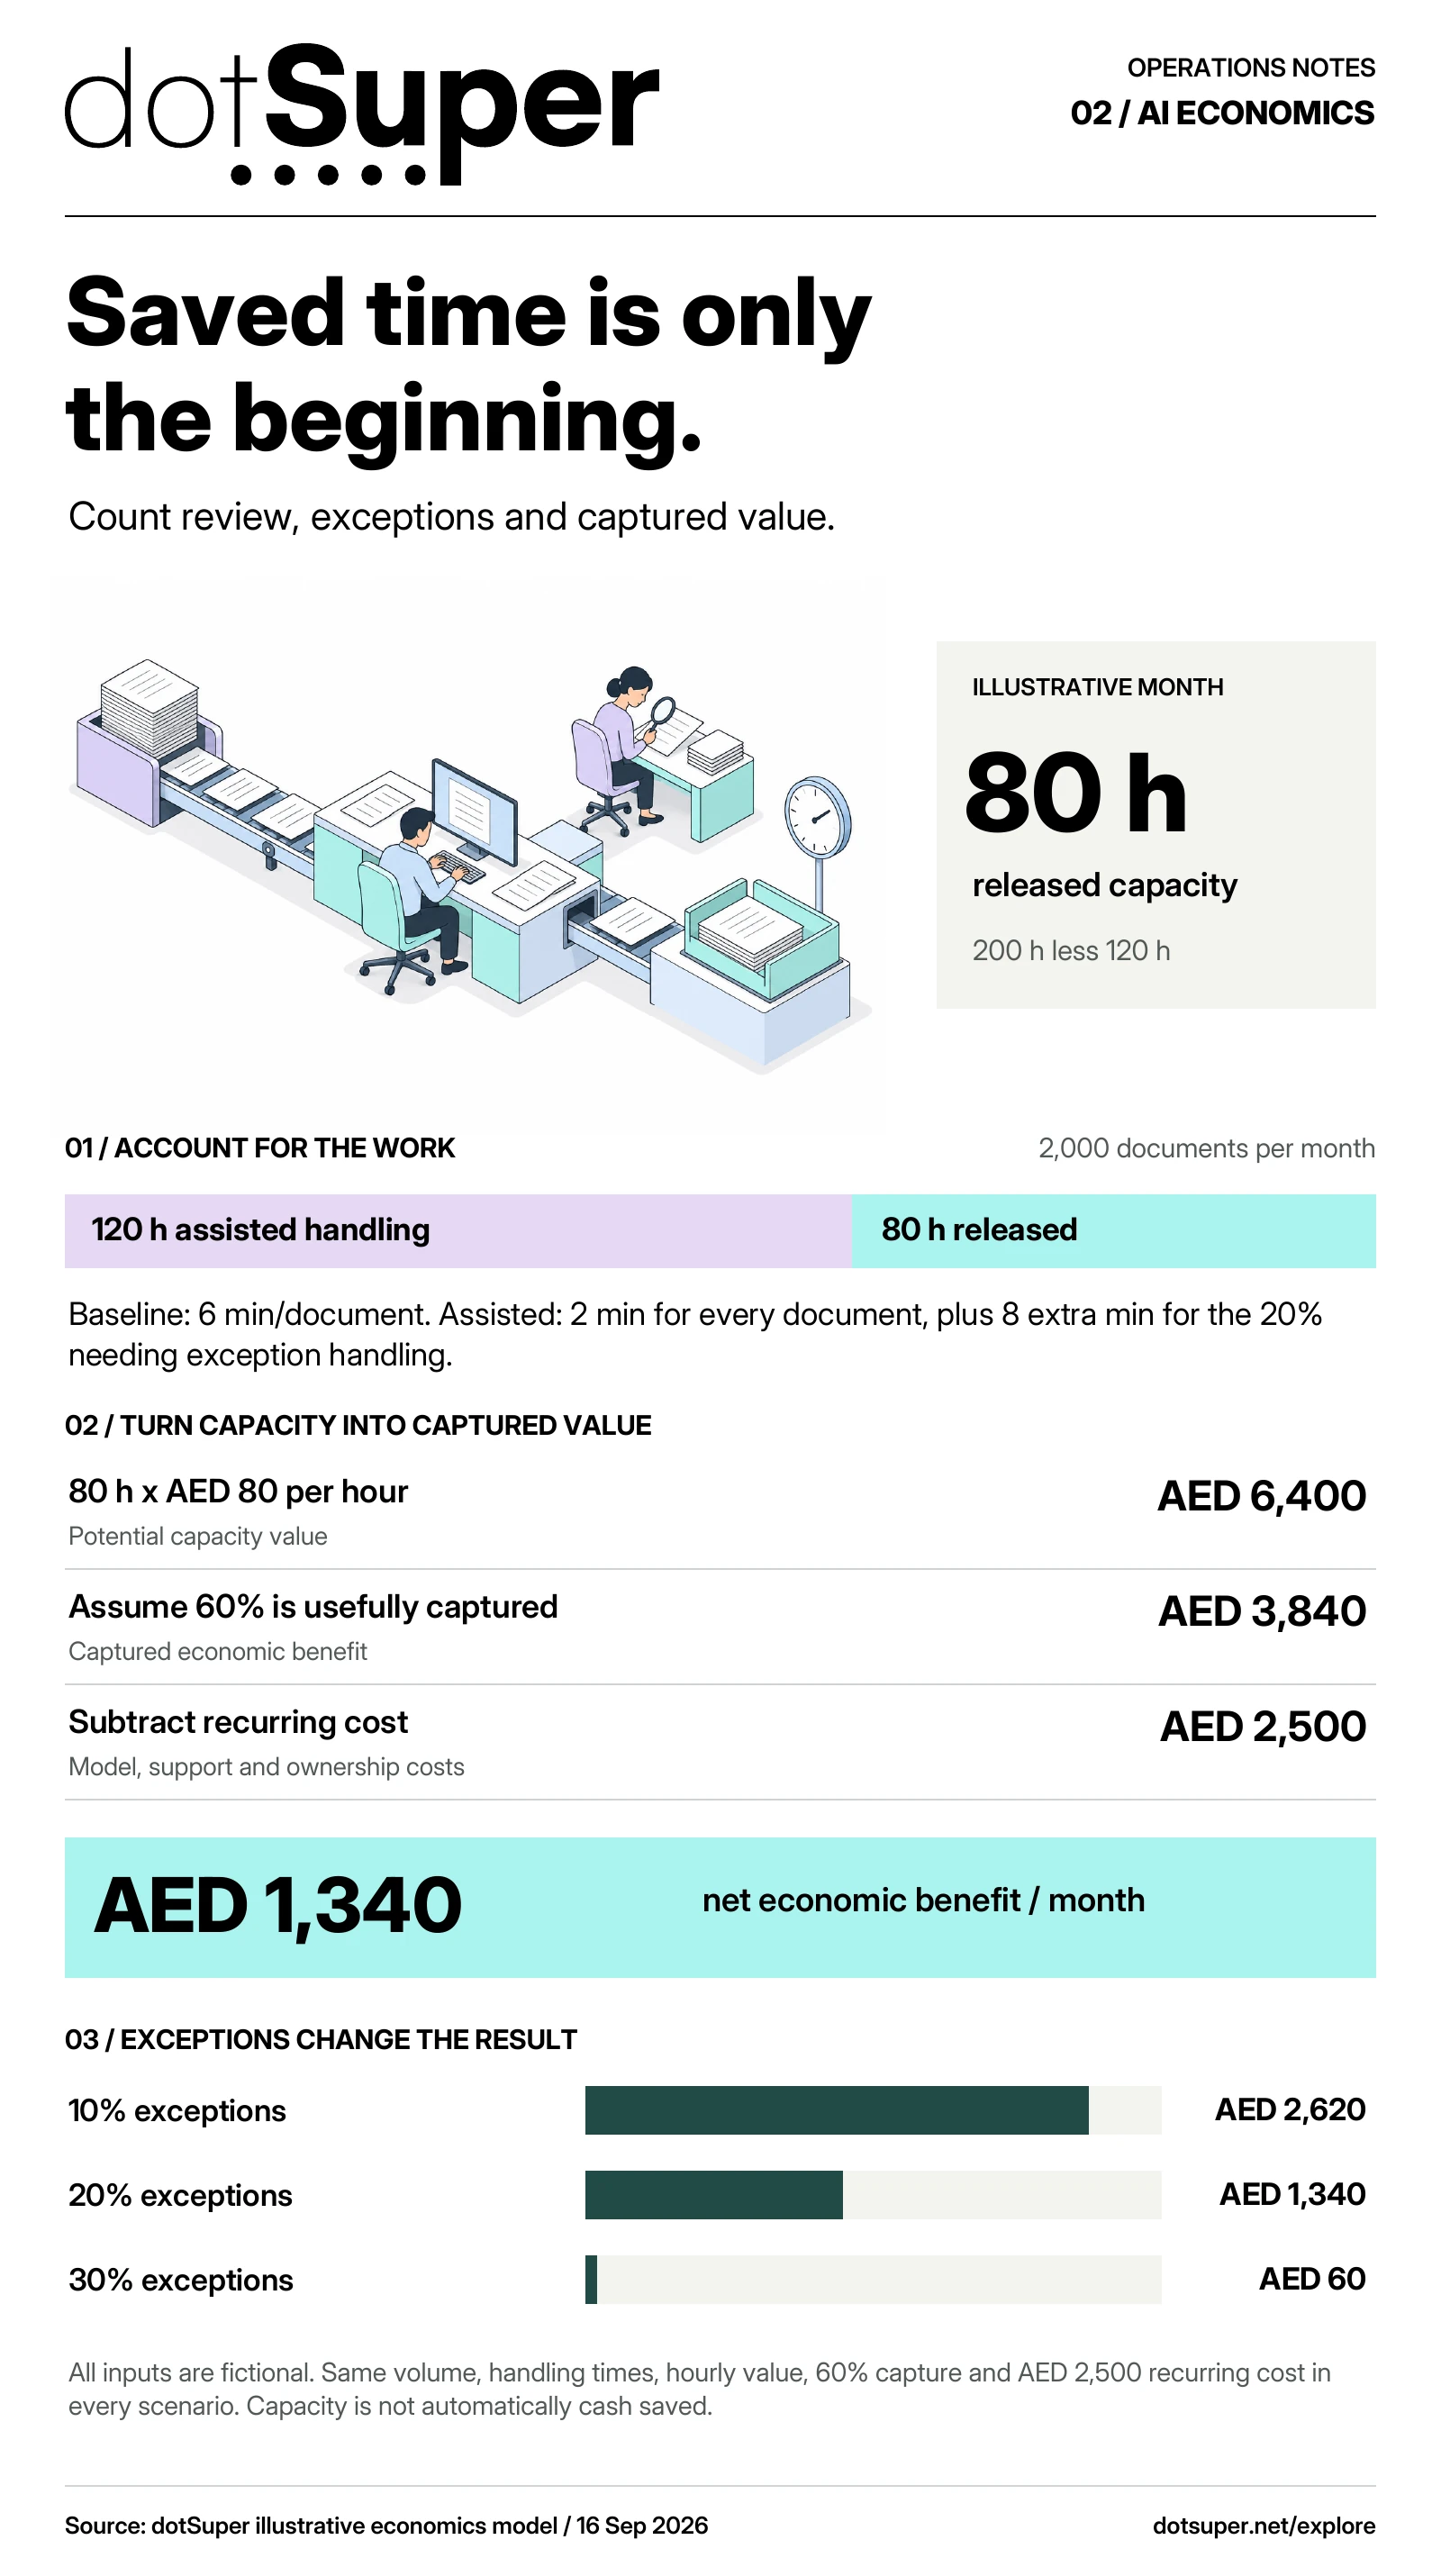
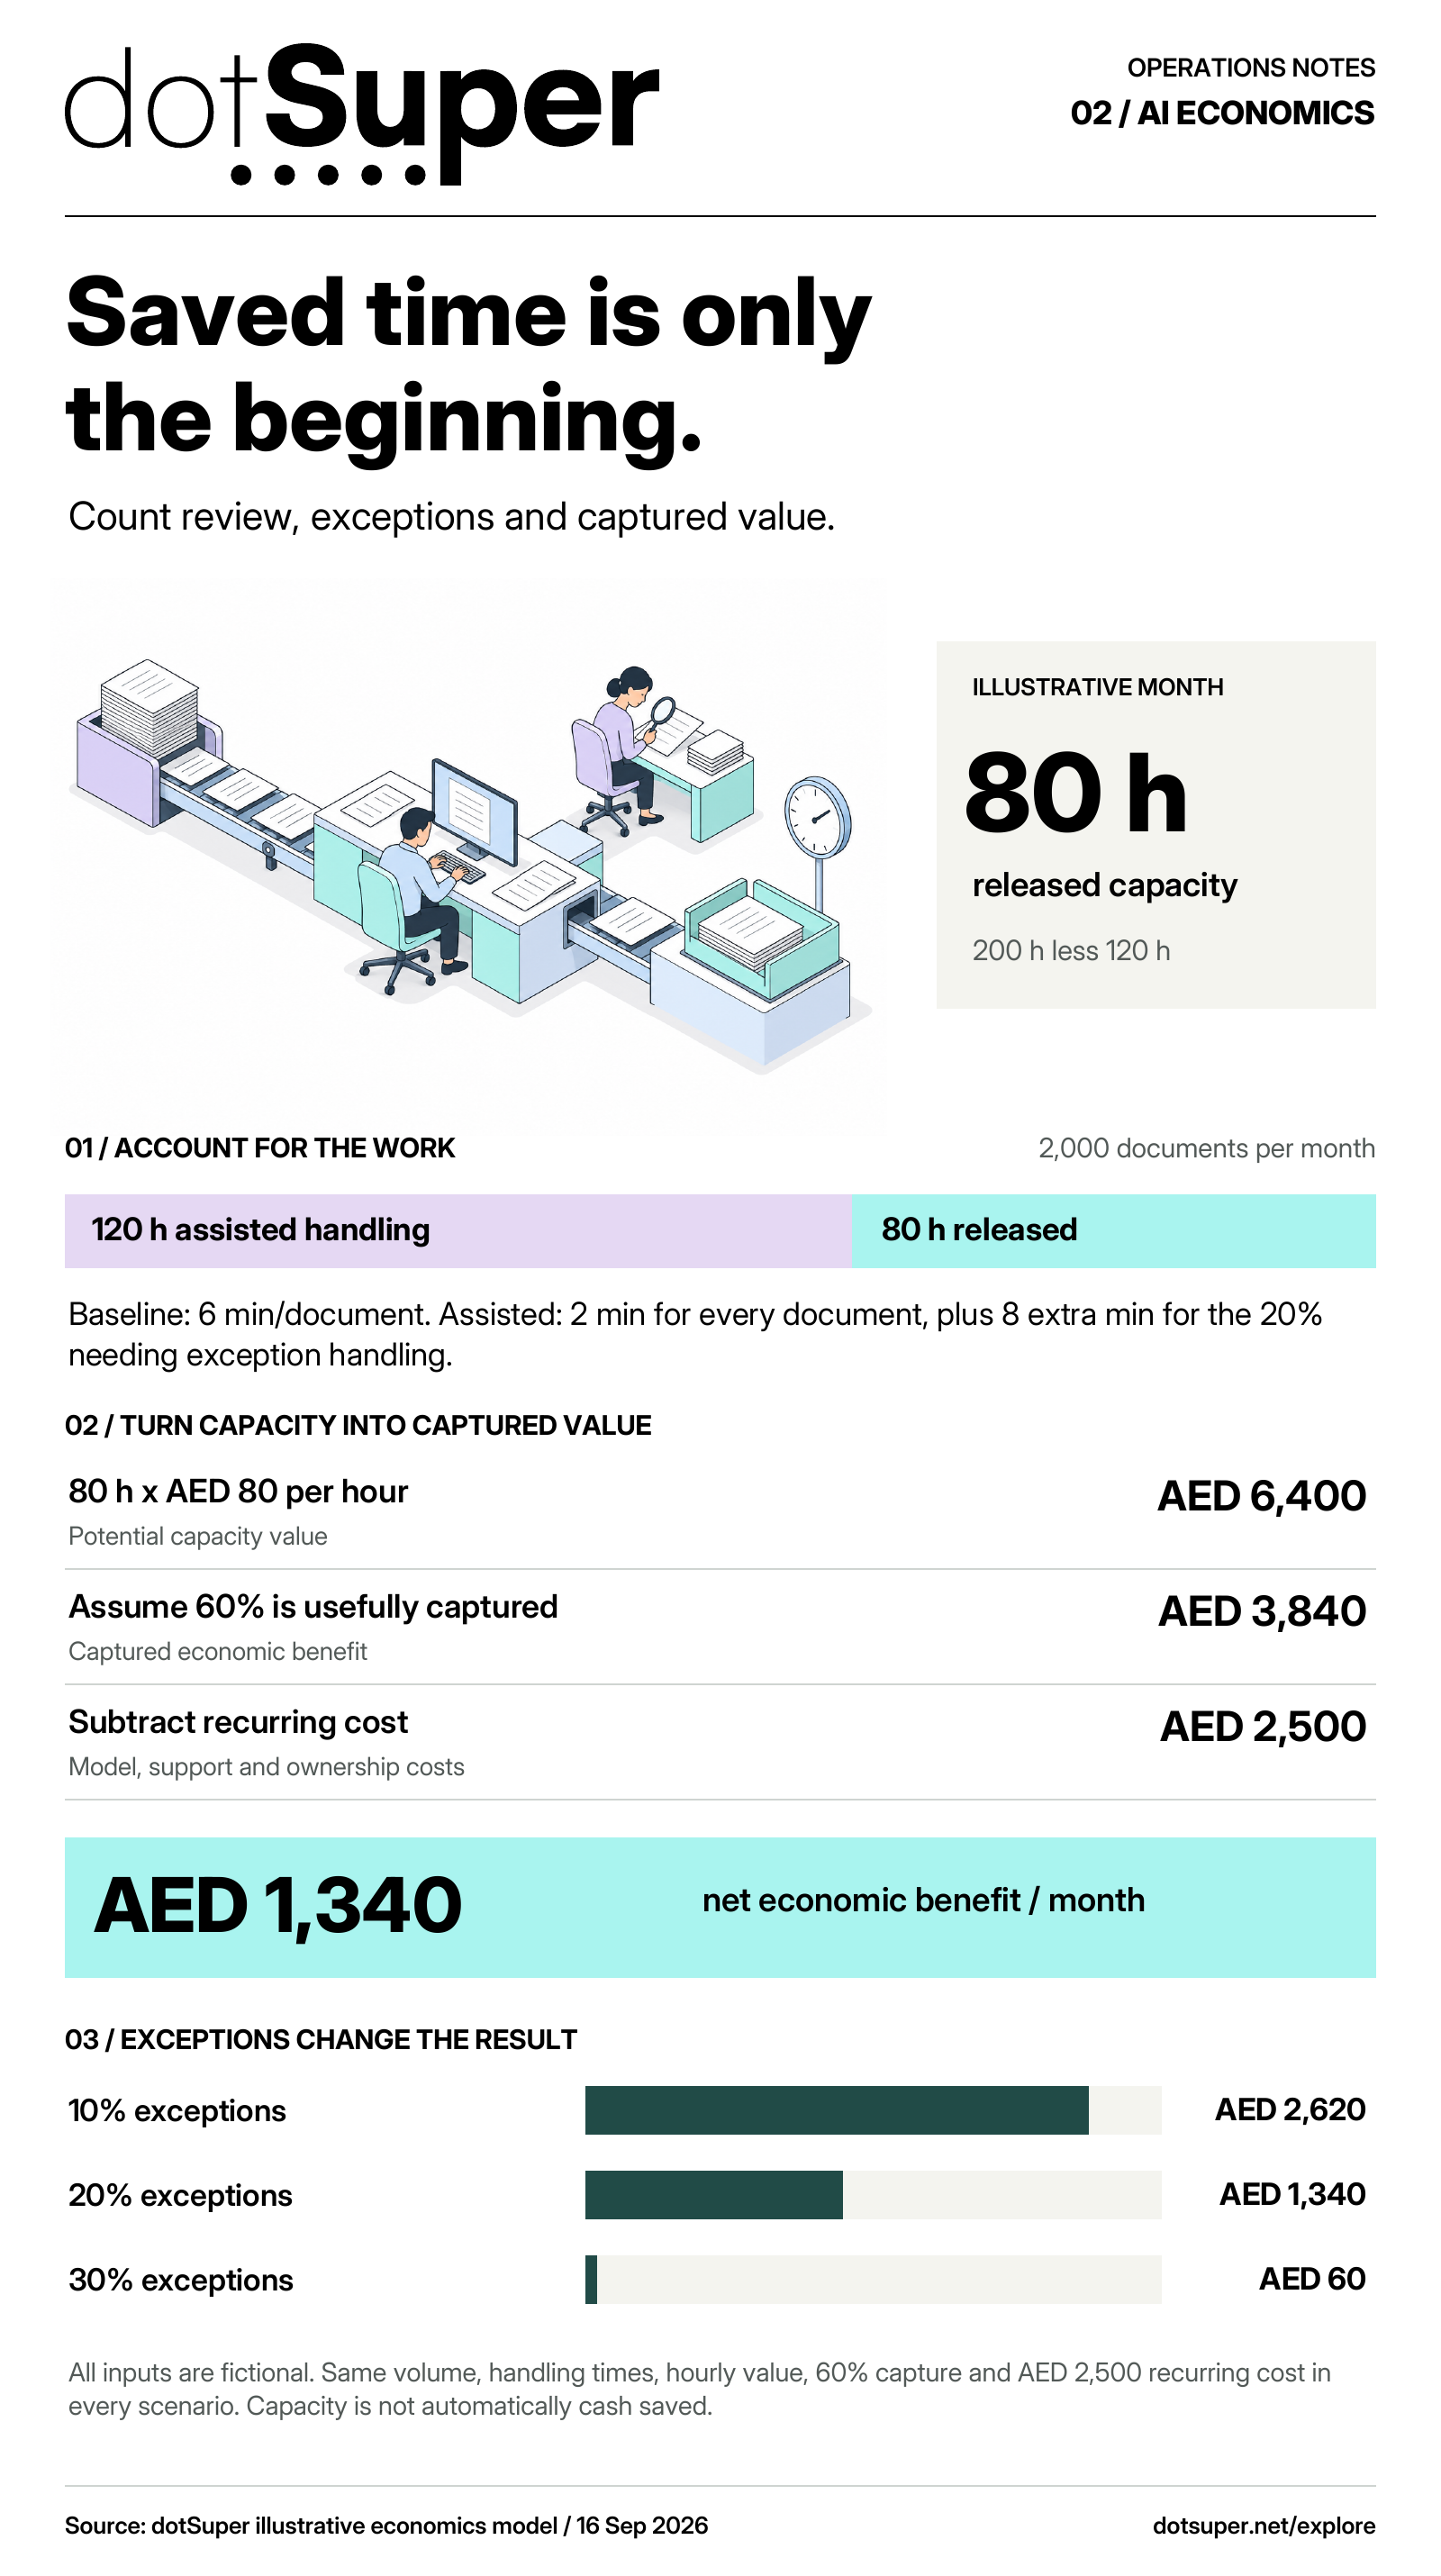
Read the diagram: Count routine handling, exceptions and the value you can actually capture. In this fictional workflow, a small change in exception share changes the result materially.
An illustrative AI workflow releases 80 of 200 baseline hours. At AED 80 per hour, 60% capture and AED 2,500 recurring cost, net economic benefit is AED 1,340 monthly. With 10%, 20% and 30% exceptions, net benefit is AED 2,620, 1,340 and 60 respectively. Capacity is not automatically cash saved.
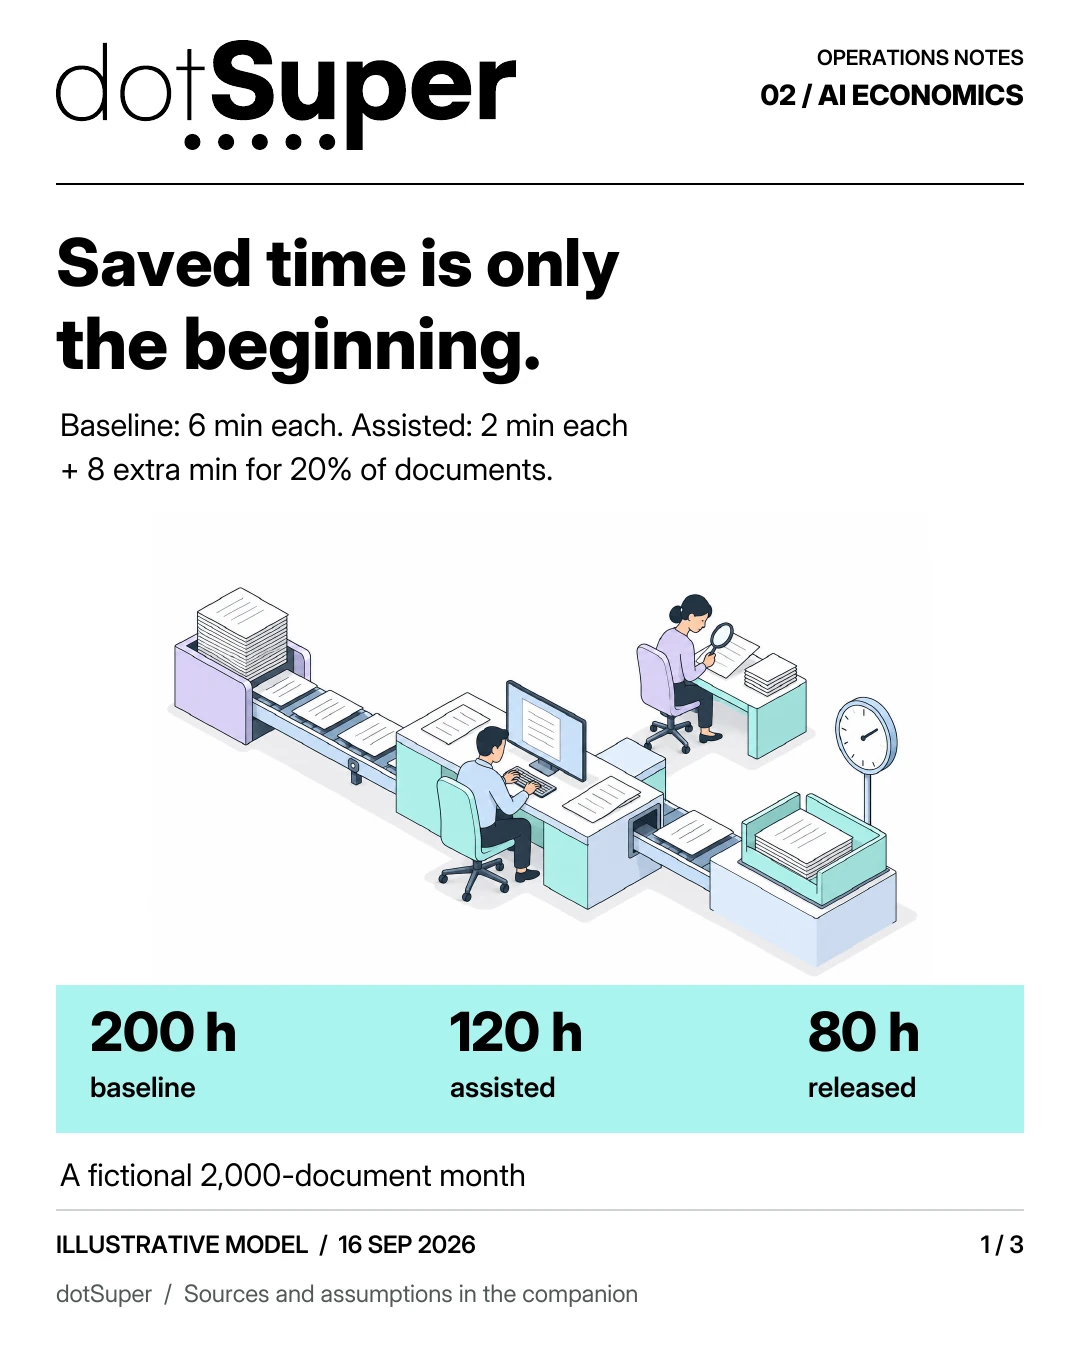
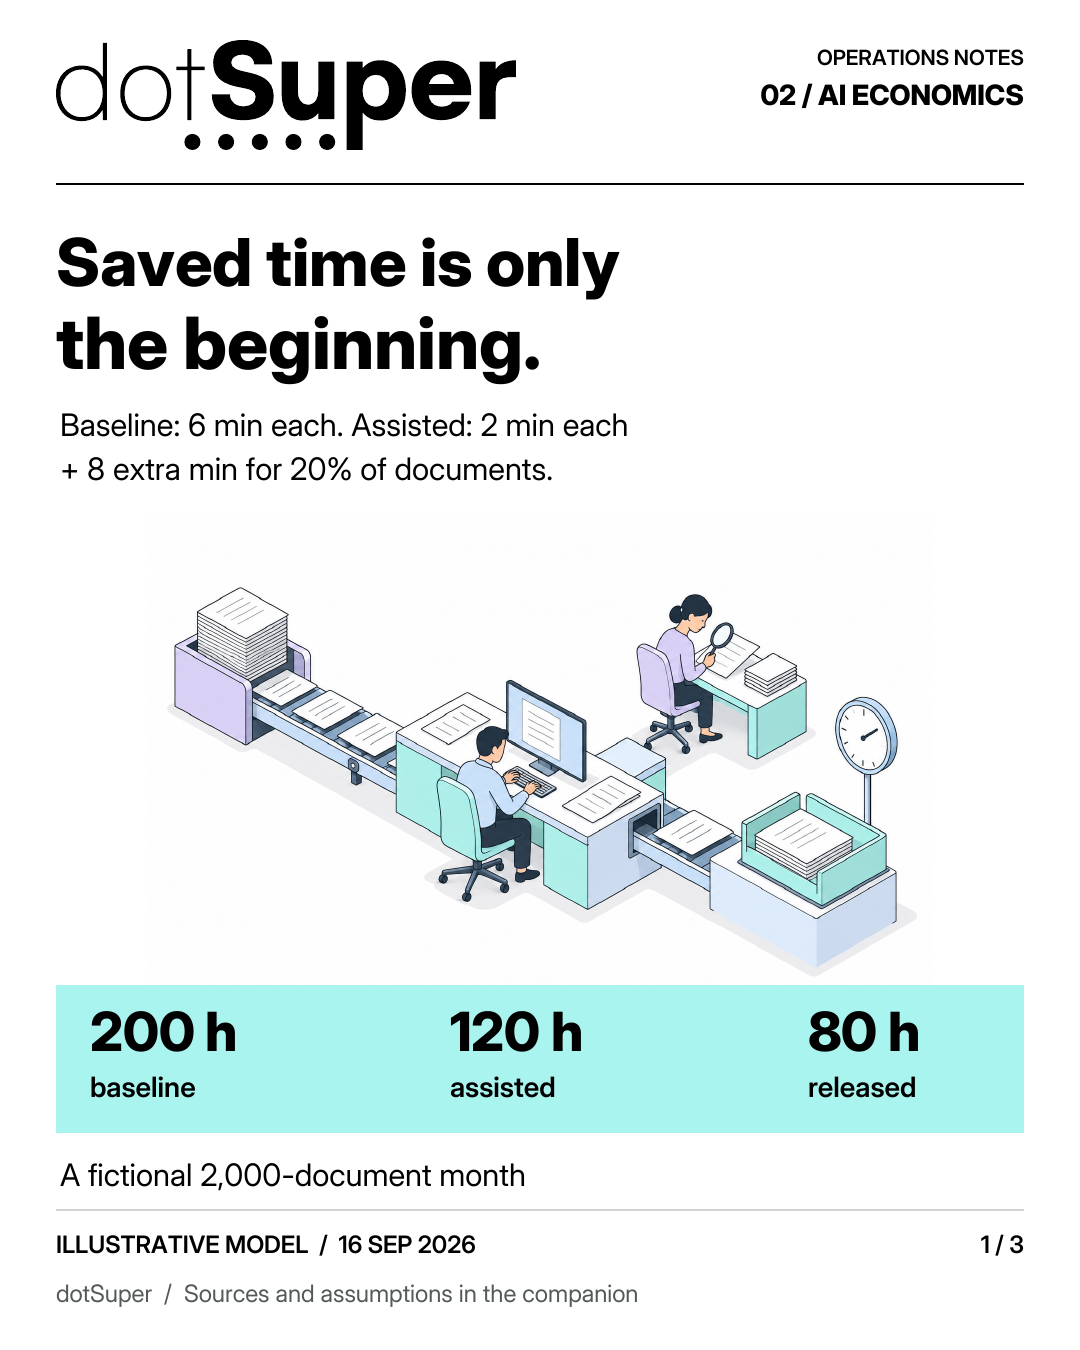
Base assumptions: 2,000 documents per month, six baseline minutes each, two routine assisted minutes for every document, and eight additional minutes for the 20% that need exception handling.
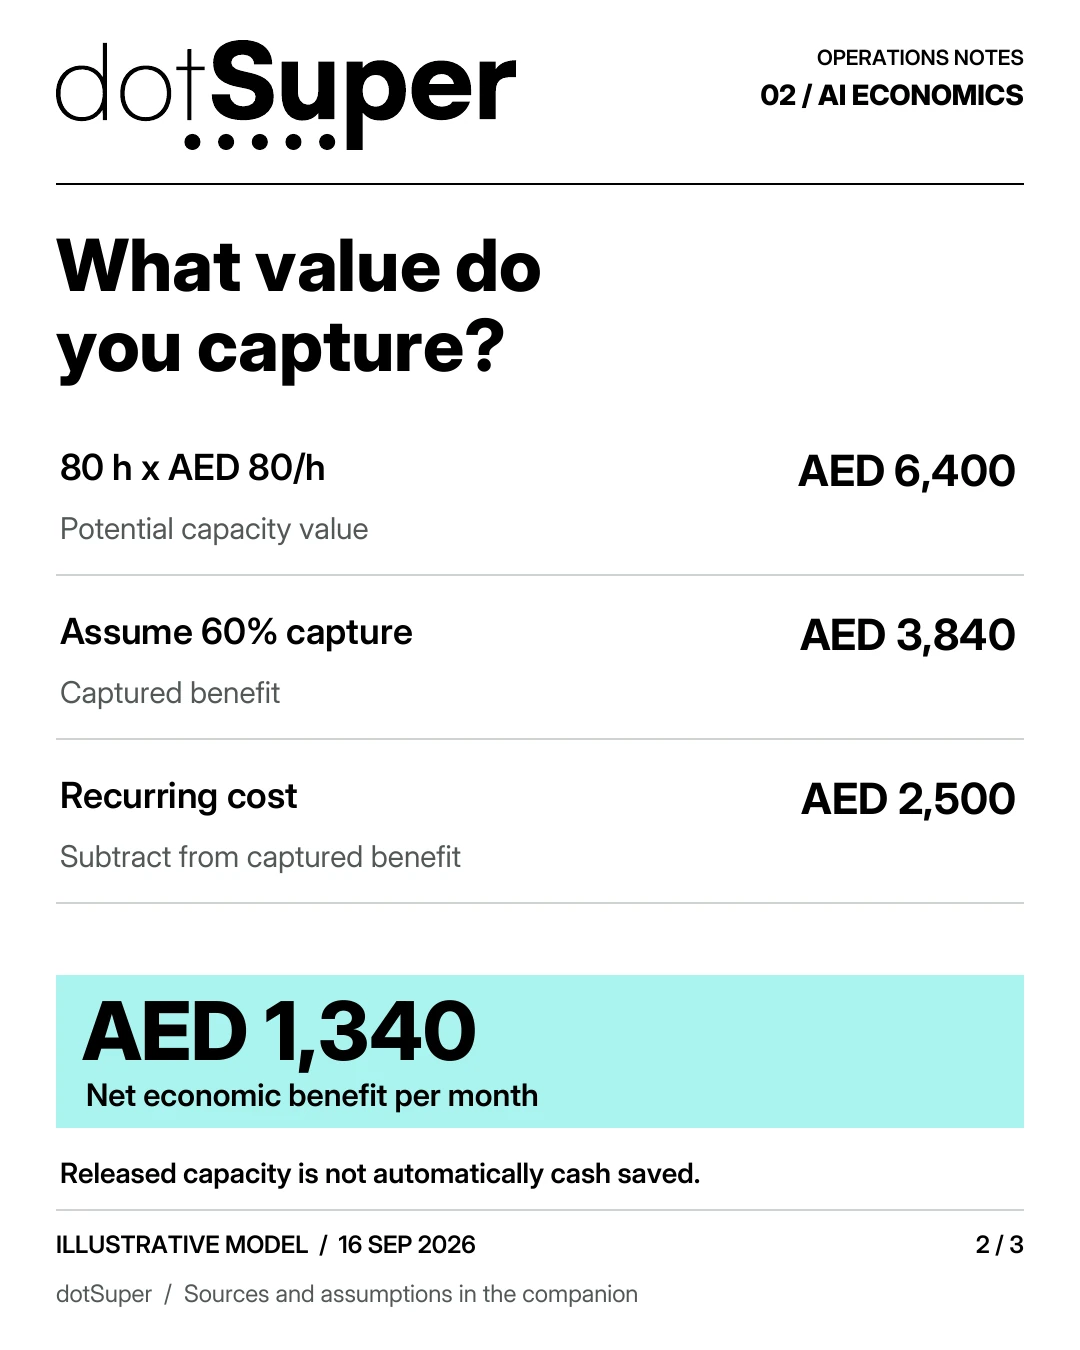
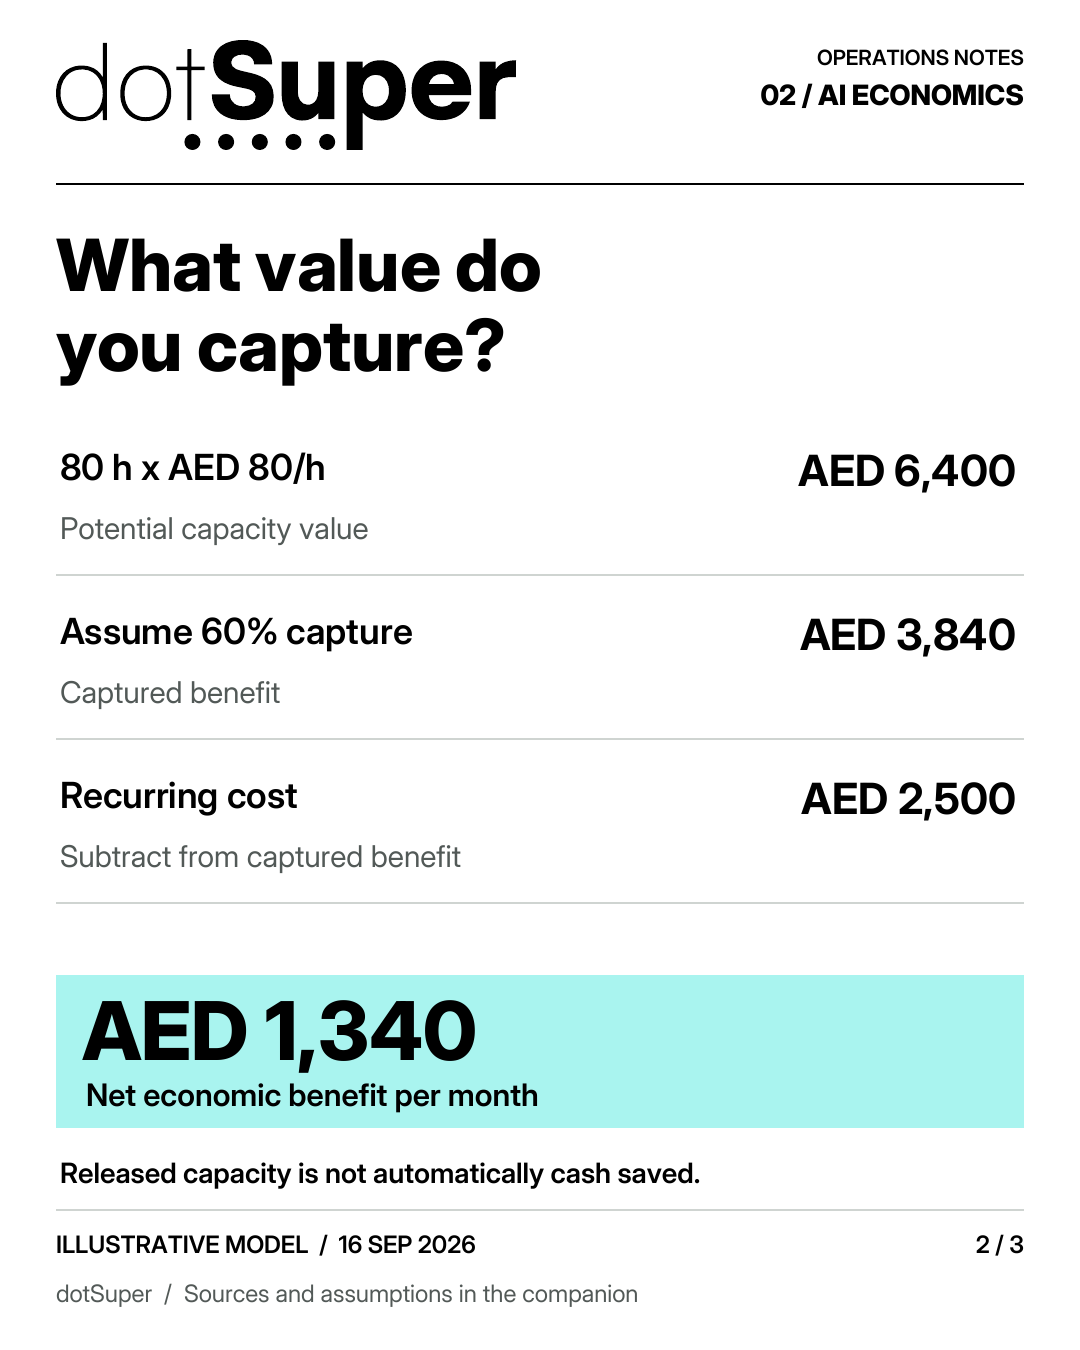
Baseline: 200 hours. Assisted: 120 hours. Released: 80 hours. At AED 80 per hour, gross capacity value is AED 6,400; at 60% capture, benefit is AED 3,840. Less AED 2,500 recurring cost gives AED 1,340 net monthly economic benefit.
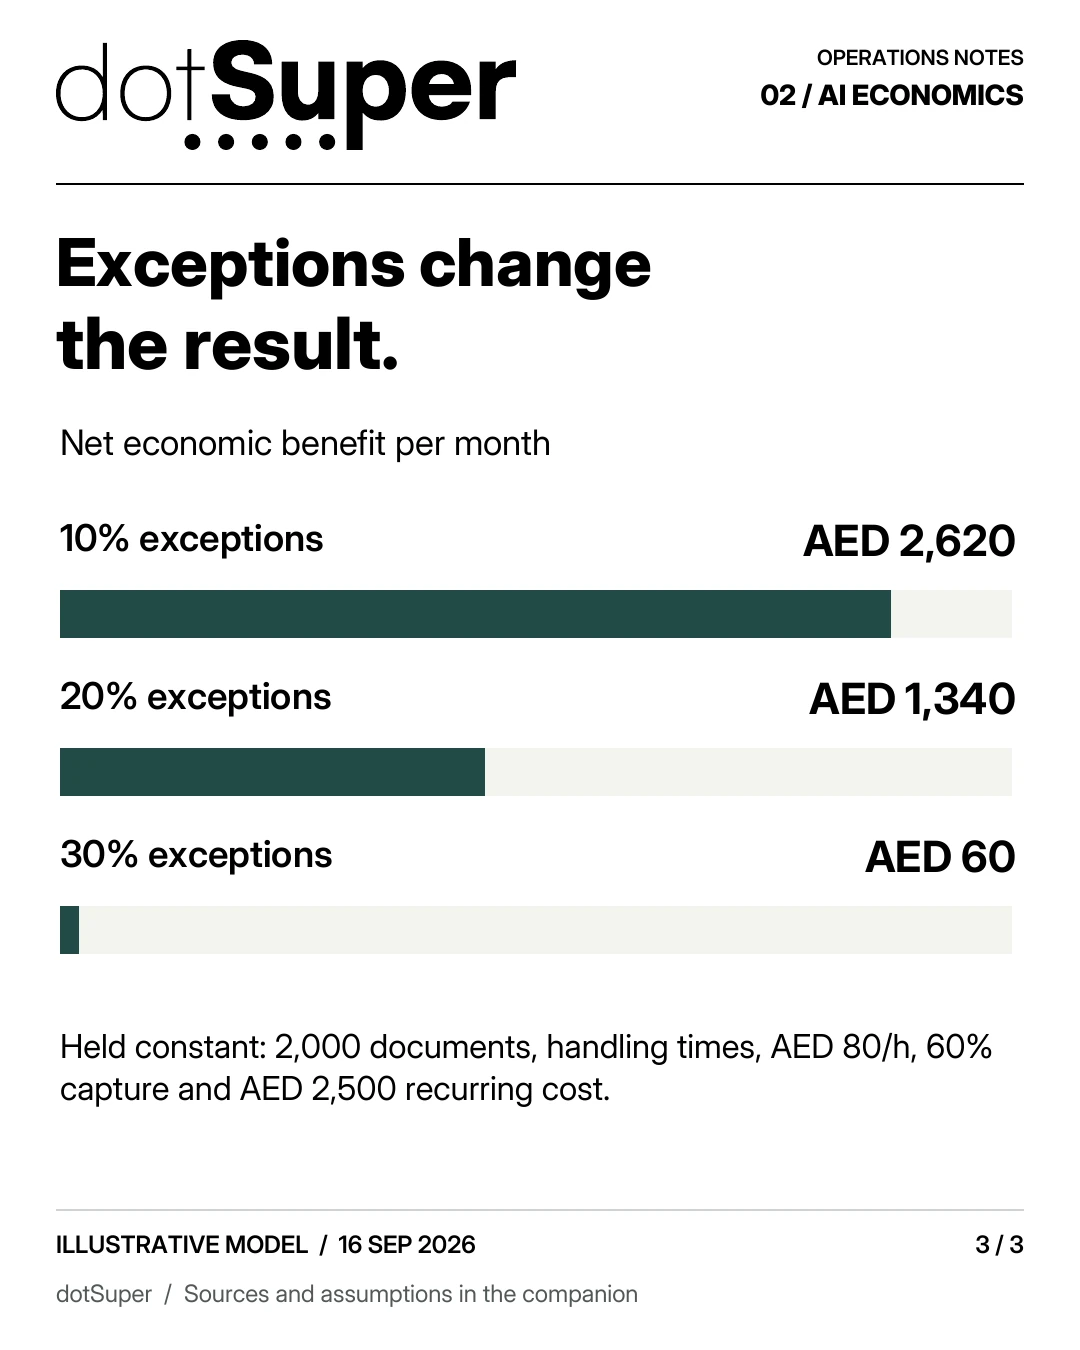
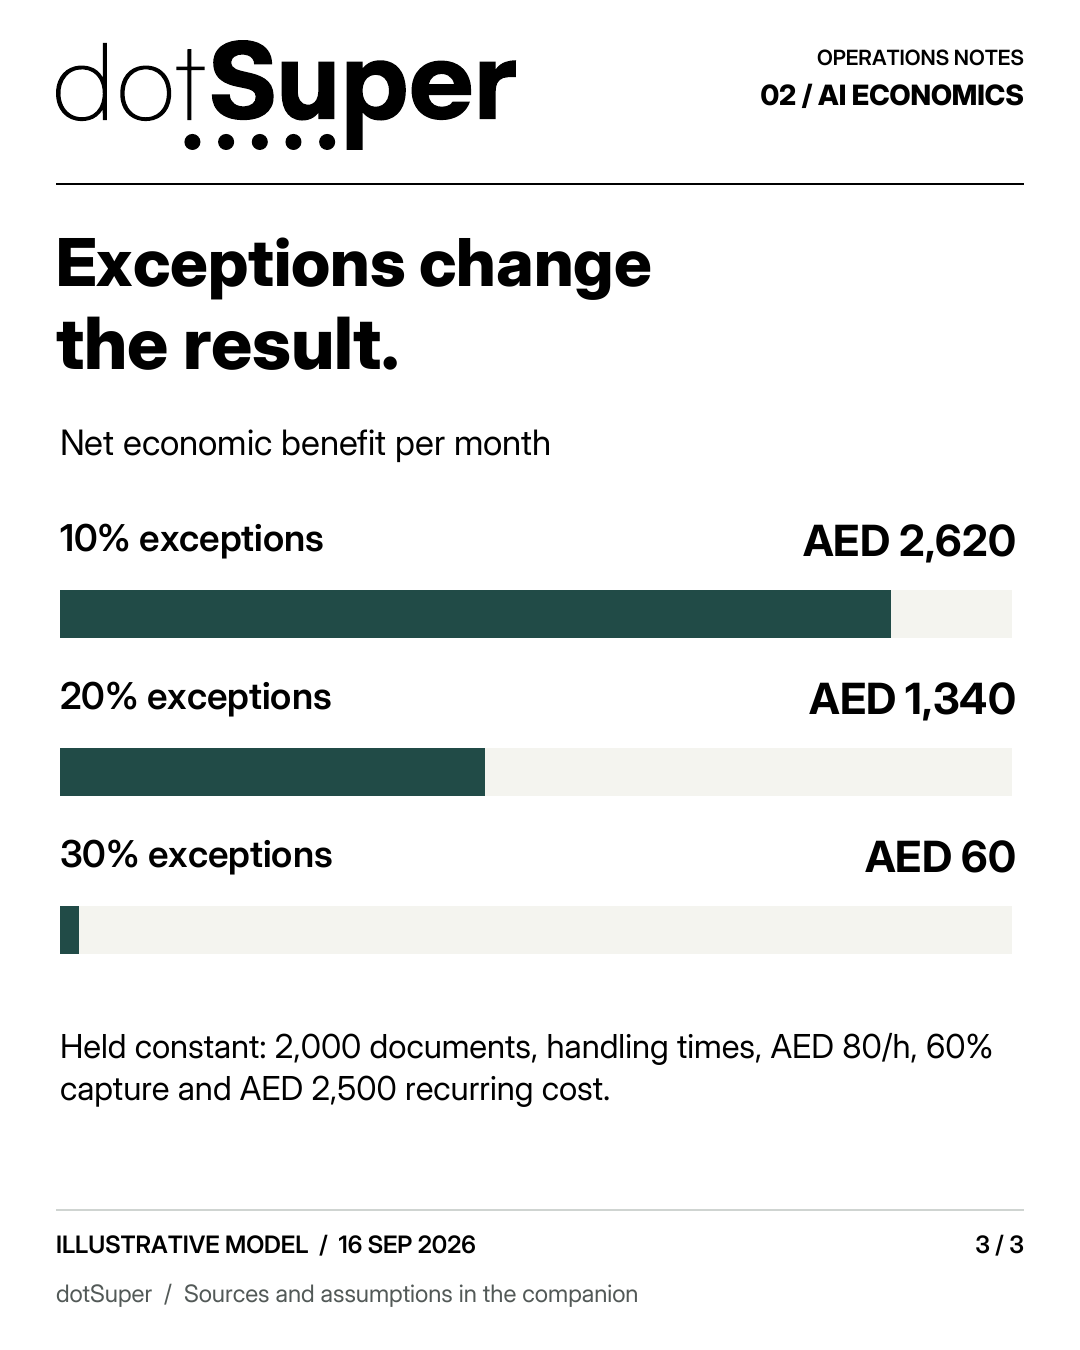
Holding volume, labour value, capture share and recurring cost constant, exception shares of 10%, 20% and 30% yield net monthly economic benefits of AED 2,620, AED 1,340 and AED 60 respectively.
AI economics panel 1 of 3. Full text and figures are in the companion above.
AI economics panel 2 of 3. Full text and figures are in the companion above.
AI economics panel 3 of 3. Full text and figures are in the companion above.
All workflow inputs and AED amounts are fictional. Captured value must be evidenced and is not necessarily cash saved.
Sensitivity scenarios are not probabilities. Setup recovery, ramp-up, financing, tax and discounting are not covered by the recurring comparison.
The simple 22.4-month illustration is economic-value payback, not necessarily cash payback.
The cited productivity studies use different tasks, historical periods and research designs; none estimates returns for the hypothetical document workflow.
| Exception share | Handling hours/month | Released hours/month | Captured benefit AED/month | Net economic benefit AED/month |
|---|---|---|---|---|
| 10% | 93.3 | 106.7 | 5,120 | 2,620 |
| 20% | 120 | 80 | 3,840 | 1,340 |
| 30% | 146.7 | 53.3 | 2,560 | 60 |
Reuse: Original artwork created for dotSuper. No public reuse licence has been specified. Attribution to research sources does not grant rights to their artwork or datasets.
Read the diagram: Panel 1 of 3. AI economics panel 1 of 3.
AI economics panel 1 of 3. Full text and figures are in the companion above.
All workflow inputs and AED amounts are fictional. Captured value must be evidenced and is not necessarily cash saved.
Reuse: Original artwork created for dotSuper. No public reuse licence has been specified. Attribution to research sources does not grant rights to their artwork or datasets.
Read the diagram: Panel 2 of 3. AI economics panel 2 of 3.
AI economics panel 2 of 3. Full text and figures are in the companion above.
All workflow inputs and AED amounts are fictional. Captured value must be evidenced and is not necessarily cash saved.
Fictional example: exception sensitivity.
Exception share: 10%; Handling hours/month: 93.3; Released hours/month: 106.7; Captured benefit AED/month: 5,120; Net economic benefit AED/month: 2,620.
Exception share: 20%; Handling hours/month: 120; Released hours/month: 80; Captured benefit AED/month: 3,840; Net economic benefit AED/month: 1,340.
Exception share: 30%; Handling hours/month: 146.7; Released hours/month: 53.3; Captured benefit AED/month: 2,560; Net economic benefit AED/month: 60.
| Exception share | Handling hours/month | Released hours/month | Captured benefit AED/month | Net economic benefit AED/month |
|---|---|---|---|---|
| 10% | 93.3 | 106.7 | 5,120 | 2,620 |
| 20% | 120 | 80 | 3,840 | 1,340 |
| 30% | 146.7 | 53.3 | 2,560 | 60 |
Reuse: Original artwork created for dotSuper. No public reuse licence has been specified. Attribution to research sources does not grant rights to their artwork or datasets.
Read the diagram: Panel 3 of 3. AI economics panel 3 of 3.
AI economics panel 3 of 3. Full text and figures are in the companion above.
All workflow inputs and AED amounts are fictional. Captured value must be evidenced and is not necessarily cash saved.
Fictional example: exception sensitivity.
Exception share: 10%; Handling hours/month: 93.3; Released hours/month: 106.7; Captured benefit AED/month: 5,120; Net economic benefit AED/month: 2,620.
Exception share: 20%; Handling hours/month: 120; Released hours/month: 80; Captured benefit AED/month: 3,840; Net economic benefit AED/month: 1,340.
Exception share: 30%; Handling hours/month: 146.7; Released hours/month: 53.3; Captured benefit AED/month: 2,560; Net economic benefit AED/month: 60.
| Exception share | Handling hours/month | Released hours/month | Captured benefit AED/month | Net economic benefit AED/month |
|---|---|---|---|---|
| 10% | 93.3 | 106.7 | 5,120 | 2,620 |
| 20% | 120 | 80 | 3,840 | 1,340 |
| 30% | 146.7 | 53.3 | 2,560 | 60 |
Take it into your next working session
Keep the source credits with the file. Check the reuse terms and adapt the method to your context.
Credit: dotSuper original fictional worked-example data.
Reuse: Original illustrative data. No public reuse licence has been specified. These are not client measurements or research results.
Reuse: Original artwork created for dotSuper. No public reuse licence has been specified. Attribution to research sources does not grant rights to their artwork or datasets.
Reuse: Original artwork created for dotSuper. No public reuse licence has been specified. Attribution to research sources does not grant rights to their artwork or datasets.
Reuse: Original artwork created for dotSuper. No public reuse licence has been specified. Attribution to research sources does not grant rights to their artwork or datasets.
Reuse: Original artwork created for dotSuper. No public reuse licence has been specified. Attribution to research sources does not grant rights to their artwork or datasets.
Reuse: Original artwork created for dotSuper. No public reuse licence has been specified. Attribution to research sources does not grant rights to their artwork or datasets.
Reuse: Original artwork created for dotSuper. No public reuse licence has been specified. Attribution to research sources does not grant rights to their artwork or datasets.
Thumbnail credit and reuse
Reuse: Original artwork created for dotSuper. No public reuse licence has been specified. Attribution to research sources does not grant rights to their artwork or datasets.
- 01Count routine handling, review, exceptions, ownership and recurring costs in the same workload.
- 02The fictional base case releases 80 hours but captures only AED 3,840 of benefit before AED 2,500 of recurring cost.
- 03Increasing exceptions from 20% to 30% reduces net monthly economic benefit from AED 1,340 to AED 60.
- 04Productivity studies describe different tasks, workers and tool versions. They cannot be averaged into a universal AI return.
/ dotSuper point of view
Saved time becomes an economic result only when the organisation captures its value and pays for the surrounding work. The exception rate can change the result materially.
Audience, question and answer
Count the complete workflow, not only model usage.
Measure review, exceptions, integration, monitoring and ownership.
Separate released capacity, avoided spending, incremental contribution and risk reduction.
These can all matter, but adding them without clear boundaries can double-count the same benefit.
The business case is a conditional model that should improve as evidence arrives.
It is not a guarantee of savings.
This explanation supplies a framework and explicit illustrative arithmetic, not investment advice or a forecast of dotSuper client results.
Empirical evidence is mixed and contextual
Their 2025 publication reports an average 15% increase in issues resolved per hour, with substantial variation across worker experience.
That denominator is task productivity, not firm profit, staffing reduction or manufacturing output.
Generative AI at Work, Quarterly Journal of Economics 140(2), 2025, author's published-paper copy (source 1).
A different experiment points the other way.
METR's 2025 randomised study involved 16 experienced open-source developers and 246 tasks on familiar repositories; allowing the tested tools increased completion time by 19%.
This is evidence about that setting and period, not proof that all coding assistance slows work.
METR, 10 July 2025 (source 2).
METR's February 2026 update cautions that a later experiment produced an unreliable signal of current effects, including participation and task-selection issues.
Therefore the 2025 finding should not be presented as a current universal productivity estimate or as settled evidence that newer tools have the same effect.
METR, 24 February 2026 update (source 3).
Sculley and co-authors describe how machine-learning systems accumulate maintenance obligations through data and surrounding software.
The paper provides an engineering explanation for hidden work, not an empirical percentage to add to every budget.
Hidden Technical Debt in Machine Learning Systems, NeurIPS 2015 (source 4).
Build the cost model around the service delivered
A cheap model call can generate an expensive unresolved exception.
Track cost per completed, acceptable outcome alongside cost per request.
One-time work includes process discovery, data preparation, integration, permissions, evaluation, training and documentation.
Recurring work includes model or software fees, hosting, monitoring, review, exception resolution, support and periodic revalidation.
Exit work includes export, replacement, access removal and handover.
Separate internal time from external expenditure.
Both are costs, but they affect cash differently.
A salaried employee spending less time on data entry does not automatically lower payroll.
If that person uses the time to clear a backlog, the value depends on what the backlog is worth and whether the organisation captures that benefit.
Define benefit categories without overlap.
An avoided hire is different from released capacity in an existing team.
Incremental contribution should account for variable costs and demand constraints.
Avoided error cost should be based on credible incidence and consequence estimates, with uncertainty shown.
Never value the same hour as both payroll saving and extra output unless the model explains why those are separate effects.
Worked example: a fictional document workflow
Assume 2,000 documents, six minutes of baseline handling each, and a fully loaded labour value of AED 80 per hour.
Baseline effort is 200 hours.
With assistance, every document still needs two minutes of handling.
Twenty percent also require eight additional exception minutes.
Total effort is (2,000 × 2 + 400 × 8)/60 = 120 hours.
Released capacity is 80 hours, valued at AED 6,400 if all of it can be usefully captured.
Assume only 60% of that capacity value is captured through a specified operational use.
Captured benefit is AED 3,840 monthly.
Assume recurring non-labour and support cost of AED 2,500, after ensuring the support estimate does not duplicate the handling labour already counted.
Net monthly economic benefit is AED 1,340.
With an illustrative one-time cost of AED 30,000, simple payback is 30,000/1,340, or about 22.4 months, if benefit and costs remain stable.
It excludes discounting, taxes, financing and implementation ramp-up.
It is an economic-value payback, not necessarily cash payback.
If no spending is avoided and no extra contribution is captured, payroll-valued capacity alone cannot repay a cash outlay.
Now increase the exception share to 30%.
Handling becomes (4,000 + 600 × 8)/60 = 146.7 hours.
Released capacity is 53.3 hours, with gross value of about AED 4,266.7.
At 60% capture, benefit is AED 2,560; after recurring cost, only AED 60 remains.
Under these assumptions, the business case is highly sensitive to exceptions.
Quantitative context and sensitivity
This is sensitivity analysis, not a probability distribution.
It does not imply that these outcomes are equally likely or that a provider has achieved any of them.
At the assumed 20% exception rate, the capture share required to cover AED 2,500 recurring cost is 2,500/6,400 = 39.1%.
That threshold still excludes recovery of the initial investment.
A recurring break-even claim is therefore different from an acceptable total-project return.
A useful pilot measures the uncertain inputs most likely to change the decision.
If exception handling dominates the sensitivity, test difficult documents early.
If value capture is uncertain, agree what the released time will be used for and how that use will be verified.
| Illustrative scenario | Exception share | Handling hours | Captured monthly benefit | Net monthly benefit |
|---|---|---|---|---|
| Lower exceptions | 10% | 93.3 | AED 5,120 | AED 2,620 |
| Base assumption | 20% | 120.0 | AED 3,840 | AED 1,340 |
| Higher exceptions | 30% | 146.7 | AED 2,560 | AED 60 |
Design the measurement before the pilot
Select comparable work, track task mix and preserve unsuccessful attempts.
Report who participated, how long the evaluation ran and what changed besides AI.
A before/after comparison can be useful operationally while remaining weak evidence of causation.
Measure adoption, rework and review quality.
People can underuse a helpful tool or overtrust a flawed one.
A short demonstration rarely captures support burden, seasonal complexity or staff turnover.
Schedule a review after the workflow has encountered real exceptions, with a named person responsible for the evidence.
Set explicit stop and continue criteria.
A pilot can correctly conclude that a simpler rule, better data or no change is preferable.
Document that decision rather than treating every pilot as the first instalment of an inevitable rollout.
Evidence and boundaries
Each source supports only the scope stated beside the claim.
| Claim | Evidence | Caveat |
|---|---|---|
| Support productivity rose 15% in the published study | Brynjolfsson et al. 2025 | One company's task measure and historical rollout |
| Developers took 19% longer in one experiment | METR July 2025 | 16 experienced developers, 246 tasks, tested tools |
| Later METR data did not reliably estimate current effect | METR February 2026 | Do not flatten versions into one timeless conclusion |
| System maintenance extends beyond model code | Sculley et al. 2015 | No universal cost percentage |
| Base net benefit is AED 1,340 | Original assumptions and arithmetic | Economic value, not guaranteed cash saving |
| Exception rate changes the case materially | Three-scenario sensitivity | Scenarios have no assigned probabilities |
One practical next step
Test the exception rate, capture share and recurring work before approving a broader rollout.
Counterevidence and limitations
A narrow time-saving model can miss those benefits.
Equally, vague strategic benefits should not become a blank cheque.
Name the outcome and the evidence that could establish it.
The two productivity studies involve different tasks, workers, tools and research designs.
They should never be averaged into a single “AI productivity effect.”
Neither directly estimates a Saudi manufacturer's returns or a UAE accounts-payable team's performance.
No model price, vendor quote or market-wide ROI benchmark is asserted.
Prices and contracts change; collect current quotes for a real decision.
No search-volume or popularity claim is made.
What this page cannot conclude
- 01All workflow inputs and AED amounts are fictional. Captured value must be evidenced and is not necessarily cash saved.
- 02Sensitivity scenarios are not probabilities. Setup recovery, ramp-up, financing, tax and discounting are not covered by the recurring comparison.
- 03The simple 22.4-month illustration is economic-value payback, not necessarily cash payback.
- 04The cited productivity studies use different tasks, historical periods and research designs; none estimates returns for the hypothetical document workflow.
Sources
- 01Generative AI at Work, Quarterly Journal of Economics 140(2), 2025, author's published-paper copyBrynjolfsson, Li and Raymond; Quarterly Journal of Economics · accessed Sep 16, 2026
- 02early-2025 developer studyMETR · accessed Sep 16, 2026
- 03February 2026 updateMETR · accessed Sep 16, 2026
- 04Sculley et al., Hidden Technical Debt in Machine Learning Systems, NeurIPS 2015Sculley and co-authors; NeurIPS · accessed Sep 16, 2026
Our editorial standard · Found an error? Send a correction with its source.
/ CITE OR SHARE THIS GUIDE
Make the evidence easy to verify.
When you reference this guide, link to its canonical URL. That gives readers one stable place for the evidence, limitations and future updates.
dotSuper Research Desk. (September 17, 2026). Saved time is only the beginning.. dotSuper. https://dotsuper.net/feeds/applied-systems/ai-costs-and-captured-value