F06 / Workflow Diagnosis
Find the constraint before adding technology.
Turn a slow or unreliable workflow into an evidence-linked map and one useful next test.
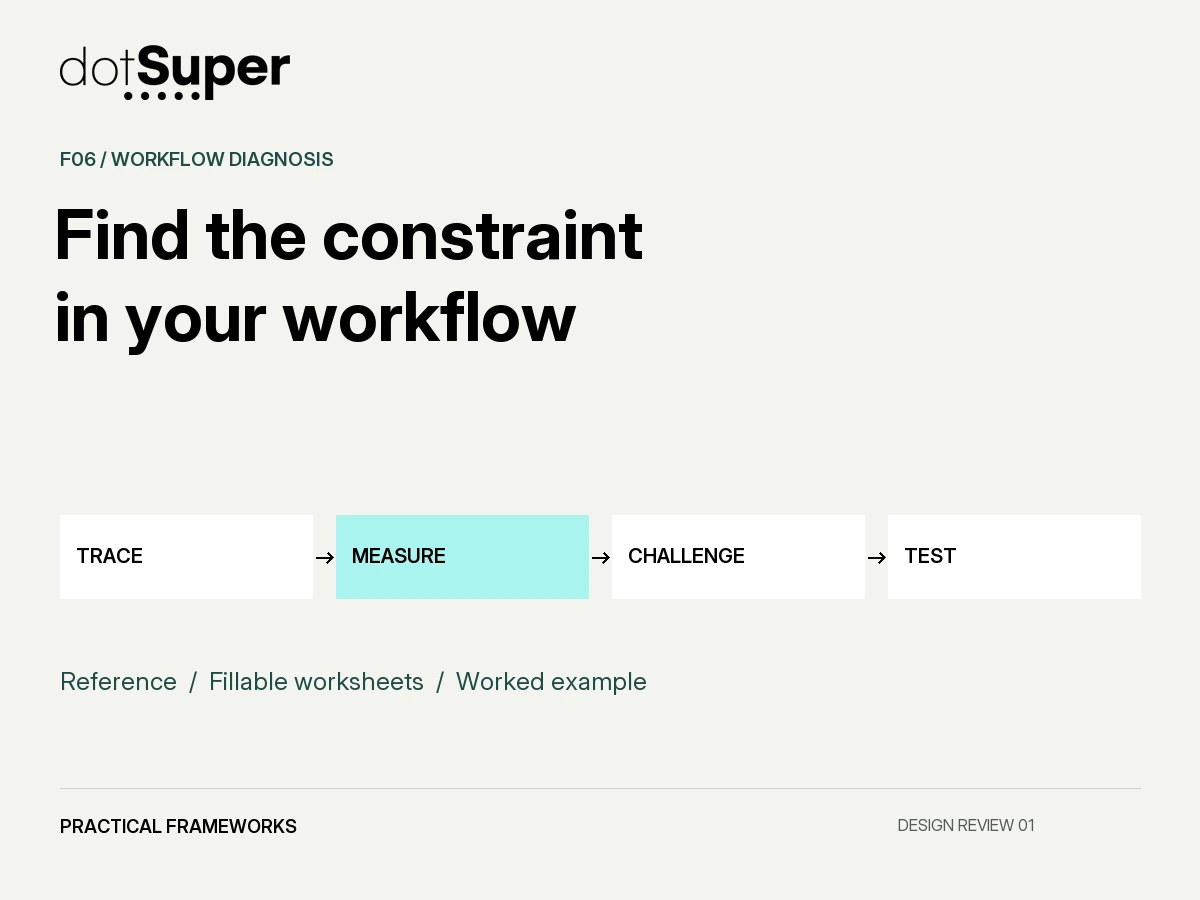
The method, in brief
What is constraining the workflow, and what should we test first?
Reconstruct actual episodes and separate active work from elapsed time. Test explanations for waiting, rework and exceptions before selecting technology. A faster local task may leave the main workflow constraint untouched.
90-minute team session plus observation. The online flow is a first draft, not a replacement for observation and team review.
Why it matters
A clearer decision, not another document.
Improve the whole flow
A faster individual task can leave the main wait untouched. This framework helps you see the work from trigger to completion.
Make hidden work visible
Clarifications, rechecks and informal recovery often explain more than the official process map.
Choose a test you can learn from
Link your next change to evidence, a measurable outcome and an owner.
How to use it
From one question to a useful next move.
Choose one real workflow
Define its trigger and finish, then bring a recent ordinary case and an exception.
Trace what actually happened
Record steps, handoffs, time and recovery, labelling estimates clearly.
Challenge the explanation
Name a suspected mechanism and what would contradict it.
Choose one next test
Compare small changes, protect quality and assign a review point.
Illustrative example, not a client result
A faster draft leaves the main delay untouched.
A hypothetical manufacturer reviews 20 supplier quotations. One episode takes 32 working hours to approval with 45 person-minutes of active work.
- 01Receive
- 02Check terms
- 03Clarify missing termsWaiting point
- 04Compare
- 05ApproveWaiting point
15 minutes → 5 minutes
Missing freight terms and the approval schedule remain.
The decision: Test an intake completeness check and an agreed exception approval route.
What to measure: Track clarification, end-to-end lead time, active effort and critical terms missed.
Active person-minutes and elapsed working hours measure different things. Do not subtract or add them as one total.
Your context. Your working draft.
Put the framework to work.
One question at a time, with guidance when you need it. Leave with a structured draft you can discuss with your team.
Answers stay in this page’s memory. Refreshing, closing or leaving the page loses your draft. Use anonymous roles and cases, not confidential information.
Why this framework matters
Improve the whole flow. A faster individual task can leave the main wait untouched. This framework helps you see the work from trigger to completion.
Make hidden work visible. Clarifications, rechecks and informal recovery often explain more than the official process map.
Choose a test you can learn from. Link your next change to evidence, a measurable outcome and an owner.
How to make your first draft
About 10–15 minutes for a first draft. The complete method calls for 90-minute team session plus observation.
Choose one real workflow. Define its trigger and finish, then bring a recent ordinary case and an exception.
Trace what actually happened. Record steps, handoffs, time and recovery, labelling estimates clearly.
Challenge the explanation. Name a suspected mechanism and what would contradict it.
Choose one next test. Compare small changes, protect quality and assign a review point.
Audience and decision
For an operations manager, process owner and frontline team choosing where to intervene in a recurring workflow. Decide which constraint to investigate, which low-risk process change to test and whether an AI opportunity merits assessment. Use this when tasks appear slow, error-prone or dependent on one employee but the team disagrees about the cause.
Start with one work type, a clear trigger and a clear completion condition. A workflow such as “supplier quotation received to comparison approved” is manageable. “Fix procurement” is not. Allow an initial 90-minute workshop plus observation across representative work, shifts and exception types. A workshop alone cannot establish the current state.
Research and source ledger
Accessed 16 September 2026.
Lineage: Current-state flow mapping, customer-facing dependencies and evidence-based countermeasures are adapted concepts. dotSuper adds an exception ledger, a consequence-based intervention choice and an explicit comparison of process, conventional automation and AI responses.
| Source and date | Contribution and boundary |
|---|---|
| Mike Rother and John Shook, Learning to See, publisher listing and authorised introductory resources | Value-stream mapping links material and information flow. The full paid workbook was not read or reproduced. Toyota practice predates its popularisation by these authors. |
| John Shook, Misunderstandings about value-stream mapping, flow analysis and takt time, 2004 | Warns against treating a map as the complete improvement process. Source-informed caution, not an effectiveness estimate. |
| G. Lynn Shostack, Designing Services That Deliver, January 1984 | Historical attribution for service blueprinting. Only accessible bibliographic material was used. |
| Sarah Gibbons, Service Blueprints: Definition, 27 August 2017, reviewed July 2026 | Practitioner explanation of dependencies across visible and backstage work. Original diagrams are not copied. |
| Lean Enterprise Institute, Questions and coaching on A3 thinking, 2019 | Informs the discipline of linking a problem to evidence and a countermeasure. A3 is an established Toyota-associated practice, not dotSuper's invention. |
Existing approaches and limitations
Process maps can accurately describe the official sequence while omitting informal recovery work. Time-and-motion observations can locate effort but miss waiting for information or authorisation. Service blueprints reveal cross-functional dependencies but may lack sufficient process data to identify a limiting constraint. A five-whys conversation can stimulate inquiry while also producing an untested causal story.
The proposed approach uses the map as an index into observed episodes. It distinguishes an apparent delay from a verified constraint and a suspected cause from a tested mechanism. The fastest task is not necessarily the best place to invest. Reducing data-entry time may simply send more incomplete work into a blocked approval queue.
Structure and rationale
Use a flow record, an exception record and a countermeasure decision. The flow record captures trigger, input, action, decision, handoff and completion. For each stage, record active labour, elapsed time, queue or waiting reason, error or rework, responsible role and evidence source. Do not add overlapping durations from different people as if they were elapsed lead time.
The exception record captures what happens when the normal path breaks, including who notices, who repairs it and how work returns to the main process. The countermeasure decision compares eliminating work, clarifying inputs, changing authority, using ordinary software and introducing AI. The selected experiment must target a plausible mechanism.
Inputs and preparation
Bring recent completed cases, difficult cases, process documentation, relevant timestamps and the people who perform each handoff. Start with a manageable observation batch, such as ten to twenty episodes, then expand if work varies materially. The count is a practical start, not a statistical rule. Include unsuccessful or abandoned work so the map does not describe only survivors.
Agree time definitions before observation. Active labour is time a person spends working on the item. Elapsed lead time is the interval from defined start to finish. Queue time is waiting before a step can begin. Rework is repeat effort caused by a defect or changed requirement, which should be distinguished where possible. Identify whether the clock uses calendar hours or working hours.
Facilitation and use
1. Bound the workflow, 10 minutes. Name its customer, start event, finish event and eligible work types. Record exclusions and why they matter. The process owner should be able to recognise an actual completed item from the definition. 2. Reconstruct real episodes, 25 minutes. Ask staff to walk through recent work. Build the sequence from records and observed actions, then compare it with the official process. Mark undocumented steps rather than forcing them into the policy map. 3. Add evidence, 20 minutes. Attach timestamps, measurements or reported estimates. Keep estimates distinguishable. Capture task mix, shift and exception context. A spreadsheet entry time may reflect later administration rather than the actual event. 4. Trace exceptions, 15 minutes. Follow one missing-input case, one technical failure and one unusual request where relevant. Ask what prevents incorrect work from proceeding and what happens if the usual expert is absent. 5. Name candidate mechanisms, 10 minutes. Write explanations such as incomplete specifications, batch approvals or duplicate entry. State what evidence would contradict each. Do not label a person as the root cause when the mechanism is missing authority or unclear inputs. 6. Choose a countermeasure, 10 minutes. Compare the smallest practical interventions. Prefer a reversible test when possible. Define expected change, quality guardrail, owner and review date. If measurement is too weak, choose measurement as the next intervention. 7. Observe the changed process. Compare comparable work and watch downstream consequences. A local improvement that worsens total lead time or error recovery is not a system improvement.
Measures and decision rules
Report sample size, period, distribution and exclusions. Use medians and ranges for highly variable times when helpful, but preserve individual episodes for diagnosis. Do not calculate a process-wide total by summing stage medians; the result may not correspond to any typical completed case.
Use first-pass completion only with a clear denominator: items completed without a defined rework event divided by eligible completed items. Track abandoned and still-open work separately. A constraint candidate deserves a test when evidence connects it to the outcome, the owner can change it and the intervention does not merely transfer burden elsewhere. No universal “automation readiness” percentage is proposed.
Worked example: illustrative, not a measured client result
A hypothetical manufacturer reviews twenty supplier quotations. One representative episode takes 32 working hours from receipt to approved comparison. Recorded active work totals 45 person-minutes across checking, clarification and comparison. Much of the elapsed time occurs while waiting for missing freight terms and a twice-weekly approval slot. The 45 minutes and 32 hours measure different things and must not be subtracted without consistent units and overlapping-work analysis.
A demo can cut comparison drafting from 15 minutes to 5 minutes, a ten-minute local improvement. It does not remove the missing freight terms or change the approval schedule. The team therefore tests a completeness check at intake and an agreed exception-approval route before investing in AI drafting.
For the next batch, it measures eligible items requiring supplier clarification, total lead time, active effort and critical terms missed. If clarification falls but staff spend excessive time enforcing a new form, the result needs revision. If the approval queue still dominates, the next conversation concerns decision authority rather than a better extraction model.
An alternative outcome is possible: observations may show complete inputs but substantial manual transcription. In that case, an assisted extraction pilot could be justified. The framework does not preselect process redesign; it requires the proposed intervention to fit the observed mechanism.
Outputs, failure modes and validation limits
Deliver an evidence-linked current-state map, an exception inventory, baseline definitions and a countermeasure test. Keep unresolved mechanisms visible. The map should allow a new team member to identify who does what when the usual path fails.
Common failures are mapping policy instead of practice, excluding night shifts, using averages that hide extreme delays, counting duplicate log entries as separate items and classifying every non-production action as waste. Quality checks, safety steps and documentation may be necessary even when they do not directly transform the product.
A counterexample is a low-volume engineered-to-order workflow. Variation can be legitimate design work rather than a defect to eliminate. The diagnostic goal may be better handling of uncertainty and handoffs instead of standardising every decision. For physical process changes, domain safety review and existing operational controls remain necessary.
This combined diagnostic has not been field validated. Validate its usability by having frontline staff correct the map, then test the selected mechanism through a bounded change. A plausible workshop narrative is not causal proof. Sustained measurement should confirm that the end-to-end outcome improves without new burdens or harms.
Working files and reuse
The five-page PDF includes a visual reference, two fillable worksheet pages, an illustrative worked example and a facilitator/source guide. The method and source notes are available as readable text on this page.
All examples are illustrative, not measured client results. The combined diagnostic has not been field validated. The full paid Learning to See workbook was not read or reproduced; historical service-blueprinting attribution uses accessible bibliographic material. A workshop narrative is not causal proof.
Original dotSuper material prepared for review. No public reuse licence has been assigned. Third-party source material retains its own terms.
The PDF is not represented as a tagged PDF/UA document. The text on this page provides a readable alternative to the diagram and method.
See the method. Keep the context.
The visual companion
Reuse: Original dotSuper material. No public reuse licence has been specified. Contact dotSuper for reuse permissions. Third-party source material retains its own terms.
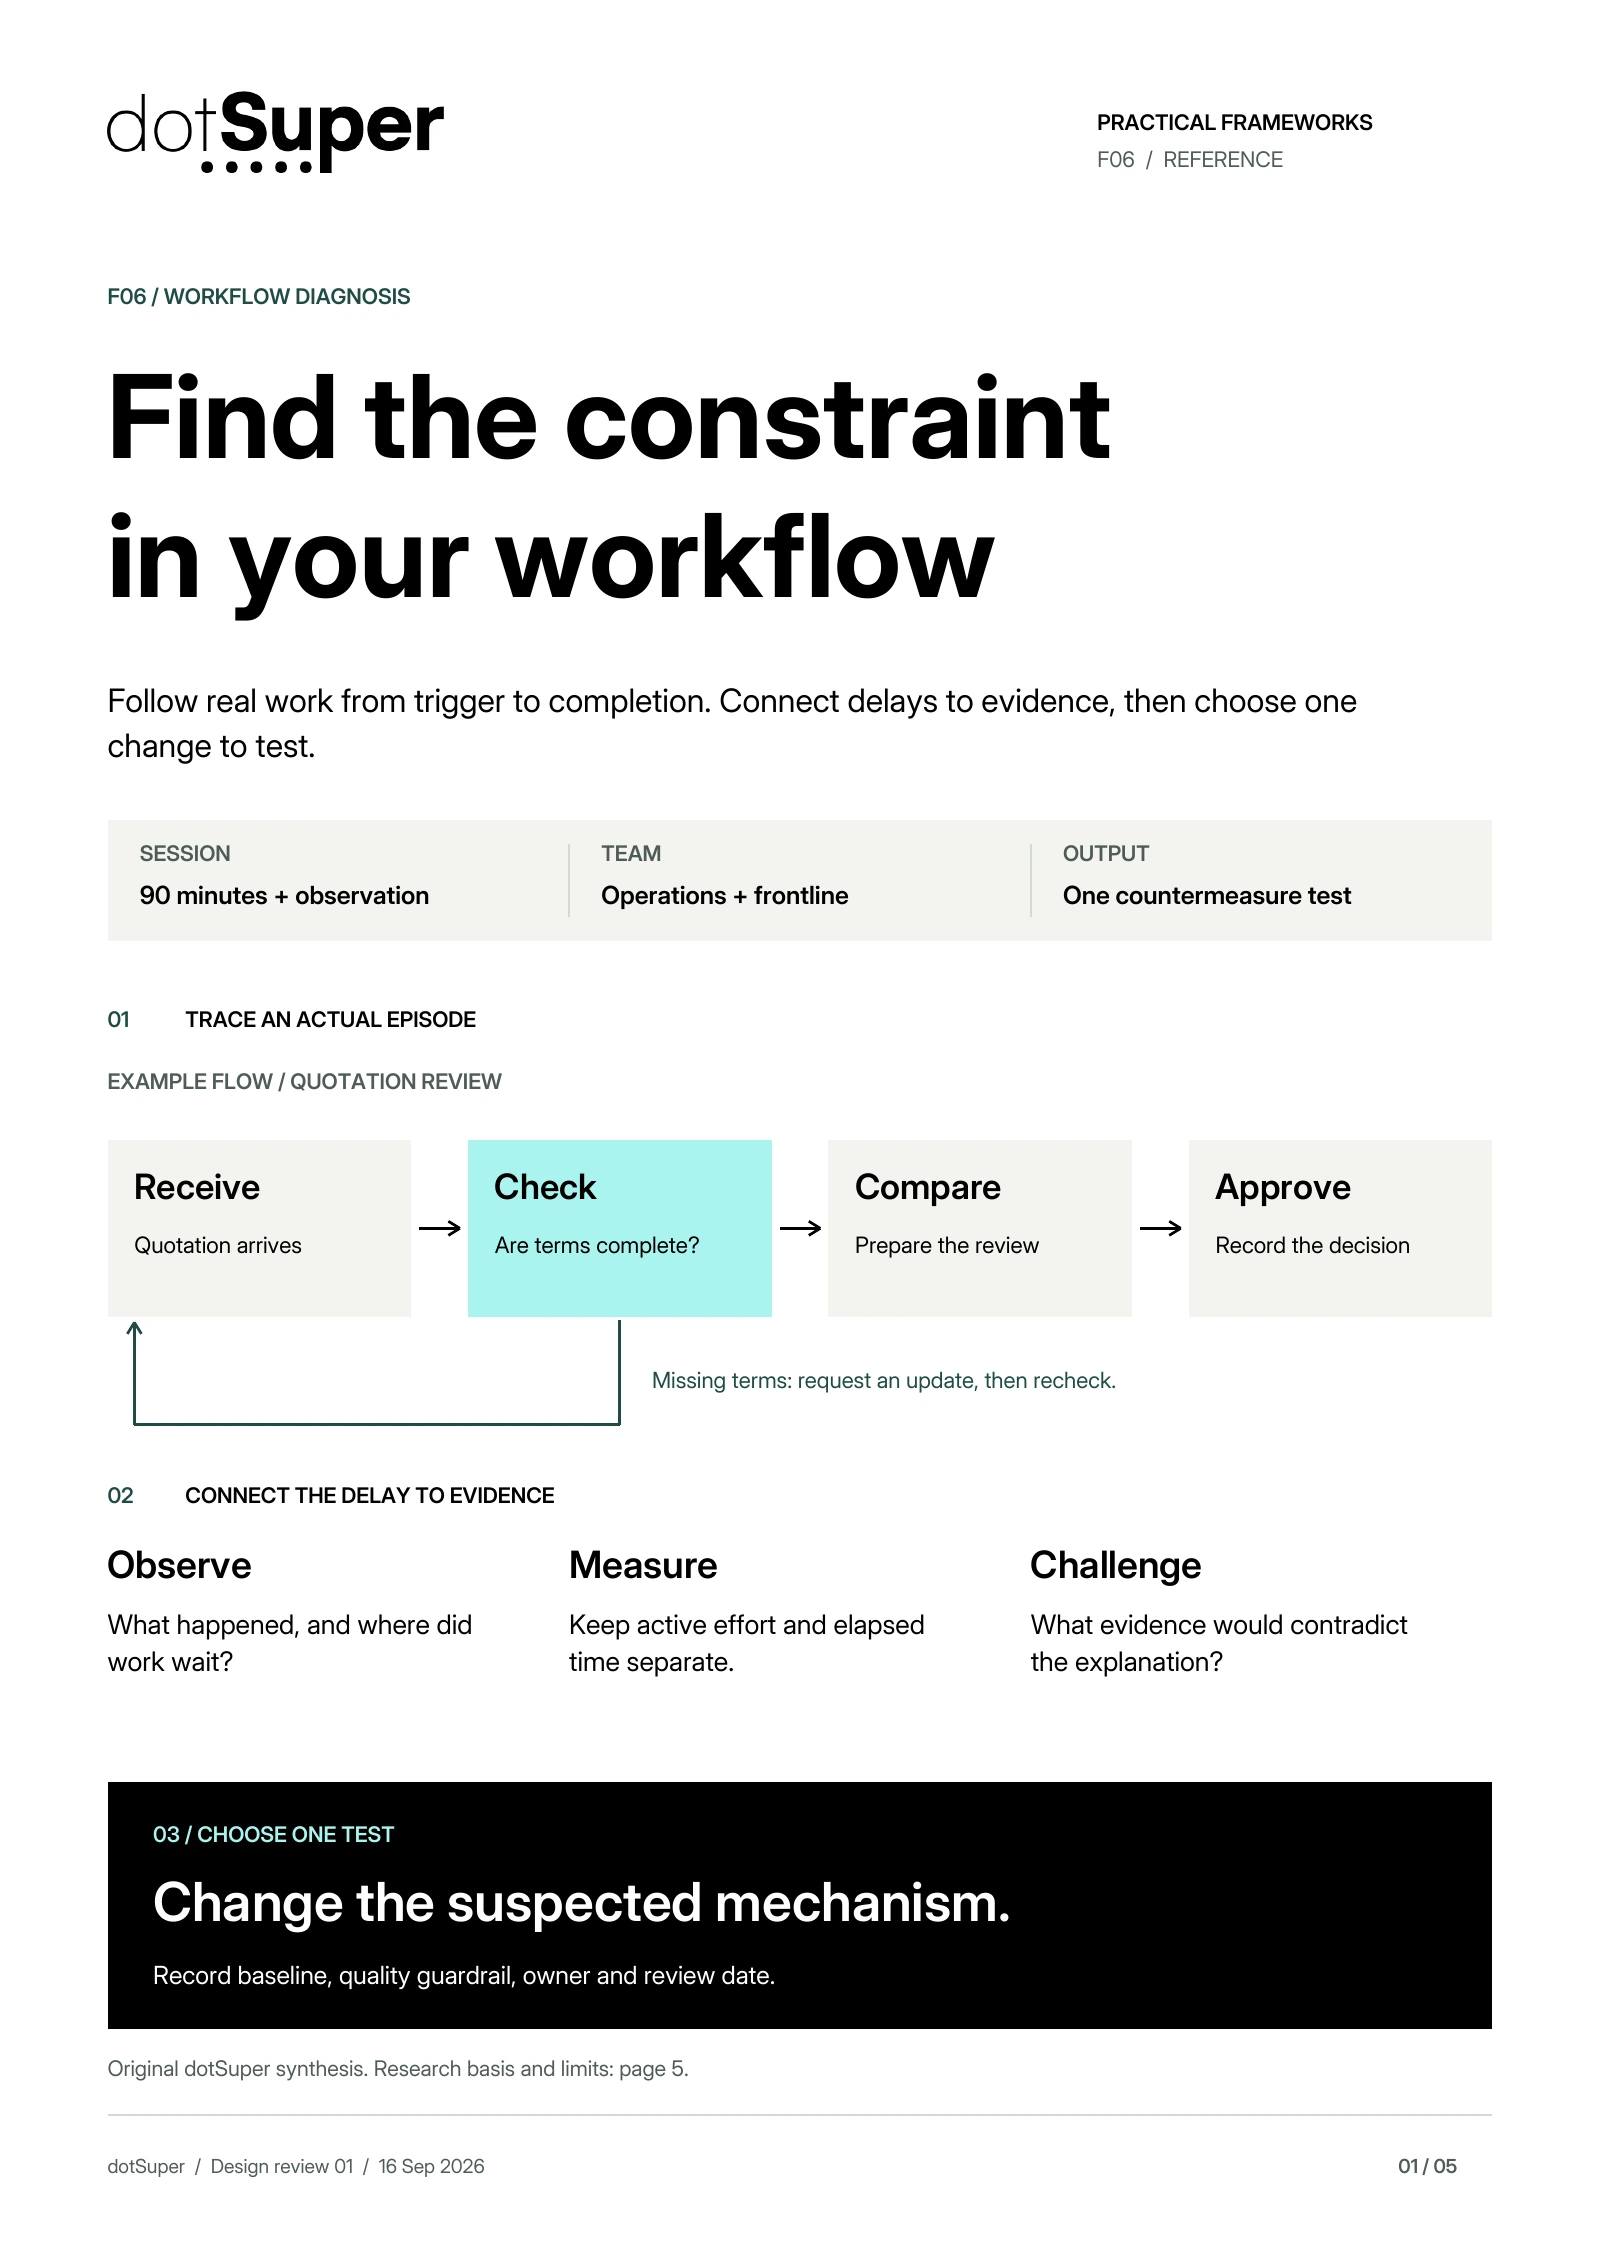
Read the diagram: Workflow Diagnosis. Original dotSuper reference diagram. Original dotSuper synthesis informed by value-stream mapping, service blueprinting and A3 thinking. Rother and Shook, Shostack and the other source authors are credited in the source ledger. No source canvas is reproduced.
Trace a recent episode from receipt through checking, comparison and approval. Missing terms require supplier clarification and rechecking.
Connect observed waiting and errors to evidence. Measure active work separately from elapsed time. Record evidence that could contradict the explanation.
Choose a change to the suspected mechanism. Record a baseline, comparator, quality guardrail, owner and review date. The combined method has not been field validated.
| Measure | Value | Scope and caveat |
|---|---|---|
| Observation batch | 20 quotations | Hypothetical sample; no population claim |
| Episode lead time | 32 working hours | Receipt to approved comparison |
| Episode active work | 45 person-minutes | Different measure from elapsed lead time |
| Comparison drafting | 15 to 5 minutes | Hypothetical local improvement of 10 minutes; not total lead-time reduction |
Take it into your next working session
Keep the source credits with the file. Check the reuse terms and adapt the method to your context.
Reuse: Original dotSuper material. No public reuse licence has been specified. Contact dotSuper for reuse permissions. Third-party source material retains its own terms.
Thumbnail credit and reuse
Reuse: Original dotSuper material. No public reuse licence has been specified. Contact dotSuper for reuse permissions. Third-party source material retains its own terms.
Sources, context and limits
Keep the evidence beside the method.
Original dotSuper synthesis informed by the sources listed. No institutional endorsement. Proposed method, not field validated.
- The combined diagnostic has not been field validated. The full paid Learning to See workbook was not read or reproduced; historical service-blueprinting attribution uses accessible bibliographic material. A workshop narrative is not causal proof.
- This combined dotSuper method is research-informed and has not been field validated. Workshop agreement and a completed template are not proof of effectiveness.
- Worked examples are hypothetical. Country examples and intended regional audience do not establish country-wide or region-wide effectiveness.
- Source access and adaptation limits are recorded in the source ledger. Attribution does not imply endorsement or a licence to reproduce third-party artwork.
- Learning to See
Lean Enterprise Institute · accessed Sep 16, 2026
- Misunderstandings about value-stream mapping, flow analysis and takt time
Lean Enterprise Institute · accessed Sep 16, 2026
- Designing Services That Deliver
Harvard Business Review · accessed Sep 16, 2026
- Service Blueprints: Definition
Nielsen Norman Group · accessed Sep 16, 2026
- Questions and coaching on A3 thinking
Lean Enterprise Institute · accessed Sep 16, 2026
/ CITE OR SHARE THIS GUIDE
Make the evidence easy to verify.
When you reference this guide, link to its canonical URL. That gives readers one stable place for the evidence, limitations and future updates.
dotSuper Research Desk. (September 17, 2026). Diagnose the Workflow Before Adding New Technology. dotSuper. https://dotsuper.net/feeds/applied-systems/workflow-diagnosis
Bring it into the work
Start with one real decision
Bring one slow or unreliable workflow and identify what is constraining it.
Download the fillable framework